|

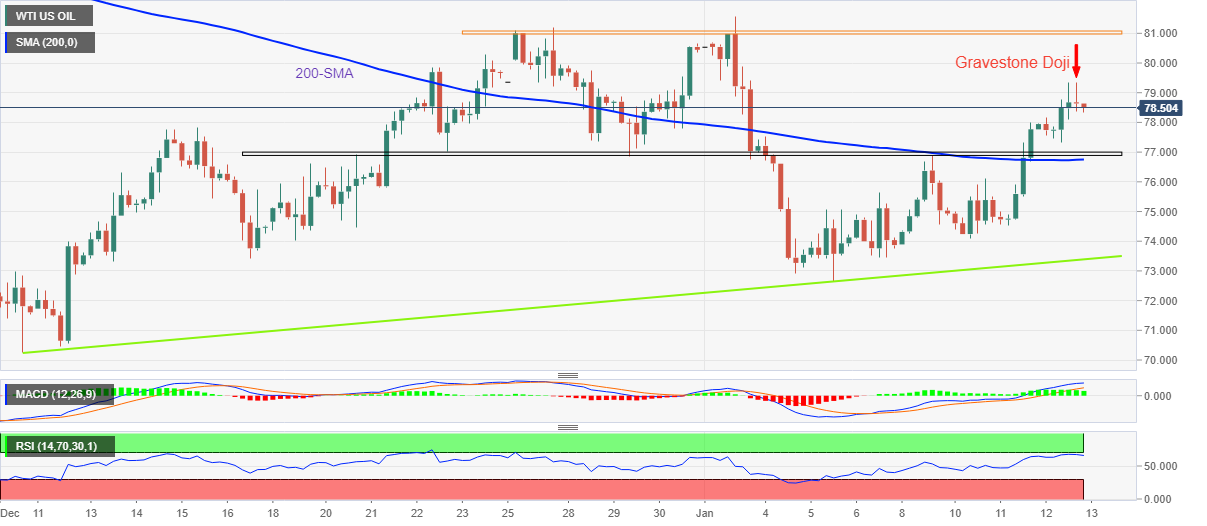
WTI Price Analysis: Bearish Doji probes Oil buyers around $78.50

  • WTI struggles to extend four-day uptrend around weekly top.
  • Gravestone Doji joins overbought RSI to probe energy bulls.
  • Three-week-old horizontal support zone, 200-SMA challenge bears.
  • Bulls could aim for $81.10 during further upside.

WTI crude oil seesaws around $78.50 as energy bulls take a breather after a four-day winning streak. That said, the black gold’s latest weakness, or inability to rise further, could be linked to a bearish candlestick formation on the four-hour chart, as well as the overbought RSI (14).

That said, the Gravestone Doji candlestick at the weekly top teases WTI sellers to revisit the $77.00-76.90 support zone comprising multiple lows marked since December 20. However, the 200-SMA level surrounding $76.75 could challenge the commodity’s further downside.

In a case where the quote remains bearish past $76.75, multiple hurdles around $75.00 could test the oil bears before highlighting an upward-sloping support line from December 09, close to $73.35 at the latest.

Alternatively, WTI crude oil prices need to cross the immediate top of $79.35 to defy the downside bias posed by the bearish candlestick.

However, a three-week-old horizontal region surrounding $80.95-81.10 could challenge the oil buyers afterward.

It’s worth noting, however, that the WTI crude oil’s run-up beyond $81.10 will need validation from the monthly high surrounding $81.55 to aim for the previous month’s peak of $83.30.

To sum up, WTI crude oil is likely to witness a pullback but the bears have a bumpy road ahead before retaking control.

WTI: Four-hour chart

Trend: Pullback expected

Additional important levels

Overview
Today last price78.52
Today Daily Change0.71
Today Daily Change %0.91%
Today daily open77.81
 
Trends
Daily SMA2077.15
Daily SMA5079.26
Daily SMA10082.58
Daily SMA20092.64
 
Levels
Previous Daily High78
Previous Daily Low74.52
Previous Weekly High81.56
Previous Weekly Low72.64
Previous Monthly High83.3
Previous Monthly Low70.27
Daily Fibonacci 38.2%76.67
Daily Fibonacci 61.8%75.85
Daily Pivot Point S175.55
Daily Pivot Point S273.29
Daily Pivot Point S372.07
Daily Pivot Point R179.03
Daily Pivot Point R280.26
Daily Pivot Point R382.51

Author

Anil Panchal

Anil Panchal

FXStreet

Anil Panchal has nearly 15 years of experience in tracking financial markets. With a keen interest in macroeconomics, Anil aptly tracks global news/updates and stays well-informed about the global financial moves and their implications.

More from Anil Panchal
Share:

Markets move fast. We move first.

Orange Juice Newsletter brings you expert driven insights - not headlines. Every day on your inbox.

By subscribing you agree to our Terms and conditions.

Editor's Picks

EUR/USD consolidates below 1.1700 amid cautious markets

EUR/USD is holding steady below 1.1700 in the European trading hours on Thursday. The pair pauses its losing streak as the US Dollar consolidates the recent recovery amid a cautious market mood and ahead of the mid-tier US employment data. 

GBP/USD turns lower to near 1.3450 amid softer risk tone

GBP/USD loses ground to trade near 1.3450 in the early European session on Thursday. Markets turn cautious amid simmering geopolitical tensions and ahead of the US labor market data due later in the day. 

Gold selling pressure persists as traders lock in profits ahead of US NFP report

Gold remains under some selling pressure for the second straight day and slides back closer to the overnight swing low during the Asian session on Thursday. The downtick lacks any fundamental catalyst and is likely to remain limited amid a supportive fundamental backdrop. 

Pi Network flashes bearish potential as selling pressure mounts

Pi Network trades above $0.2000 at press time on Thursday, following a nearly 2% decline the previous day. Centralized Exchanges have received 1.90 million PI tokens over the last 24 hours, suggesting risk-off sentiment among holders. The technical outlook for the PI token remains bearish, with a risk of a cross below the 20-day Exponential Moving Average. 

2026 economic outlook: Clear skies but don’t unfasten your seatbelts yet

Most years fade into the background as soon as a new one starts. Not 2025: a year of epochal shifts, in which the macroeconomy was the dog that did not bark. What to expect in 2026? The shocks of 2025 will not be undone, but neither will they be repeated.

Pi Network Price Forecast: PI flashes bearish potential as selling pressure mounts

Pi Network trades above $0.2000 at press time on Thursday, following a nearly 2% decline the previous day. Centralized Exchanges have received 1.90 million PI tokens over the last 24 hours, suggesting risk-off sentiment among holders.