WTI Price Analysis: Bear pennant challenges Oil buyers around mid-$68.00s


  • WTI clings to mild gains during the first positive day in three, fades upside momentum of late.
  • Sustained break of previous key support, bearish chart formation keeps Oil bears hopeful.
  • Clear break of $67.95 can trigger fresh downswing, bulls remain cautious below $74.70.

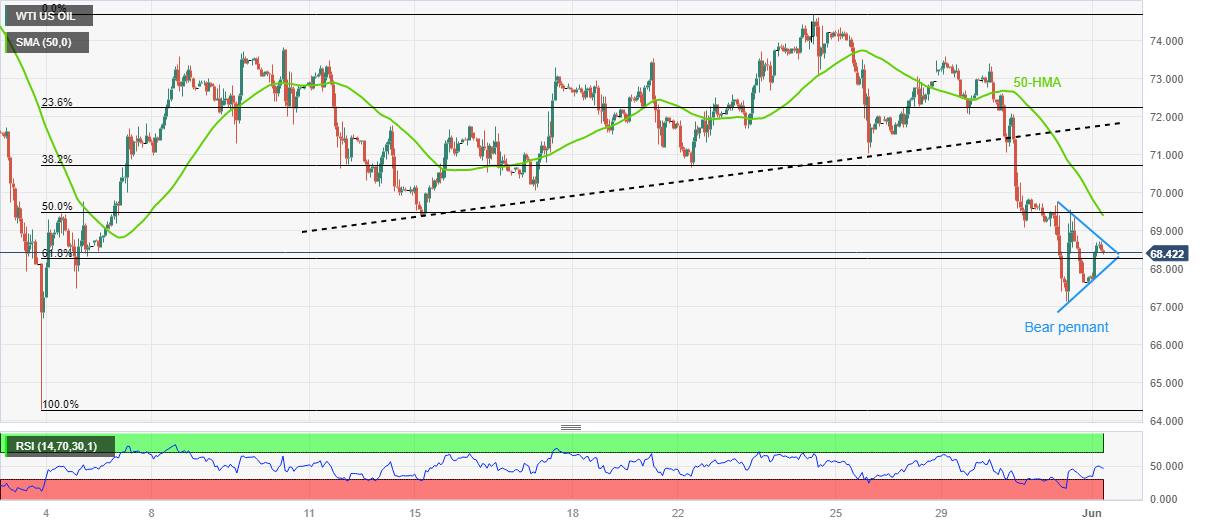
WTI crude oil consolidates the biggest weekly loss in three by printing minor upside near $68.50, making 1.10% intraday gains heading into Thursday’s European session. In doing so, the black gold snaps two-day downtrend but stays within an immediate bear pennant chart formation suggesting further declines of the energy benchmark.

It’s worth noting that the quote’s early-week break of an upward-sloping support line from May 15, now resistance near $71.75, joins the near 50.0 level of RSI (14) line to keep the sellers hopeful.

However, a clear downside break of the stated pennant’s bottom line, close to $67.95 by the press time, becomes necessary for the Oil sellers to retake control.

Following that, a slump towards the previous monthly low of around $64.30 can’t be ruled out. Though, $66.75 may act as an intermediate halt during the anticipated fall.

On the flip side, a clear break of the pennant’s top-line, near $68.80 at the latest, will defy the bearish chart formation and can propel the black gold towards a converngence of the 50-Hour Moving Average (HMA) and 50% Fibonacci retracement level of May’s upside, near $69.50.

In a case where the Oil price remains firmer past $69.50, the $70.00 round figure and the previous support line near $71.80 may act as extra checks for the bulls.

It should be observed that the energy buyers need to remain cautious unless witnessing a successful run-up beyond the previous monthly peak of around $74.70

WTI crude oil: Hourly chart

Trend: Further downside expected

Additional important levels

Overview
Today last price 68.42
Today Daily Change 0.77
Today Daily Change % 1.14%
Today daily open 67.65
 
Trends
Daily SMA20 71.69
Daily SMA50 74.73
Daily SMA100 75.86
Daily SMA200 79.3
 
Levels
Previous Daily High 69.74
Previous Daily Low 67.12
Previous Weekly High 74.7
Previous Weekly Low 70.66
Previous Monthly High 76.61
Previous Monthly Low 64.31
Daily Fibonacci 38.2% 68.12
Daily Fibonacci 61.8% 68.74
Daily Pivot Point S1 66.6
Daily Pivot Point S2 65.55
Daily Pivot Point S3 63.98
Daily Pivot Point R1 69.22
Daily Pivot Point R2 70.79
Daily Pivot Point R3 71.84


Share: Feed news

Information on these pages contains forward-looking statements that involve risks and uncertainties. Markets and instruments profiled on this page are for informational purposes only and should not in any way come across as a recommendation to buy or sell in these assets. You should do your own thorough research before making any investment decisions. FXStreet does not in any way guarantee that this information is free from mistakes, errors, or material misstatements. It also does not guarantee that this information is of a timely nature. Investing in Open Markets involves a great deal of risk, including the loss of all or a portion of your investment, as well as emotional distress. All risks, losses and costs associated with investing, including total loss of principal, are your responsibility. The views and opinions expressed in this article are those of the authors and do not necessarily reflect the official policy or position of FXStreet nor its advertisers. The author will not be held responsible for information that is found at the end of links posted on this page.

If not otherwise explicitly mentioned in the body of the article, at the time of writing, the author has no position in any stock mentioned in this article and no business relationship with any company mentioned. The author has not received compensation for writing this article, other than from FXStreet.

FXStreet and the author do not provide personalized recommendations. The author makes no representations as to the accuracy, completeness, or suitability of this information. FXStreet and the author will not be liable for any errors, omissions or any losses, injuries or damages arising from this information and its display or use. Errors and omissions excepted.

The author and FXStreet are not registered investment advisors and nothing in this article is intended to be investment advice.

Recommended content


Recommended content

Editors’ Picks

EUR/USD holds below 1.0750 ahead of key US data

EUR/USD holds below 1.0750 ahead of key US data

EUR/USD trades in a tight range below 1.0750 in the European session on Friday. The US Dollar struggles to gather strength ahead of key PCE Price Index data, the Fed's preferred gauge of inflation, and helps the pair hold its ground. 

EUR/USD News

GBP/USD consolidates above 1.2500, eyes on US PCE data

GBP/USD consolidates above 1.2500, eyes on US PCE data

GBP/USD fluctuates at around 1.2500 in the European session on Friday following the three-day rebound. The PCE inflation data for March will be watched closely by market participants later in the day.

GBP/USD News

Gold clings to modest daily gains at around $2,350

Gold clings to modest daily gains at around $2,350

Gold stays in positive territory at around $2,350 after closing in positive territory on Thursday. The benchmark 10-year US Treasury bond yield edges lower ahead of US PCE Price Index data, allowing XAU/USD to stretch higher.

Gold News

Bitcoin Weekly Forecast: BTC’s next breakout could propel it to $80,000 Premium

Bitcoin Weekly Forecast: BTC’s next breakout could propel it to $80,000

Bitcoin’s recent price consolidation could be nearing its end as technical indicators and on-chain metrics suggest a potential upward breakout. However, this move would not be straightforward and could punish impatient investors. 

Read more

US core PCE inflation set to signal firm price pressures as markets delay Federal Reserve rate cut bets

US core PCE inflation set to signal firm price pressures as markets delay Federal Reserve rate cut bets

The core PCE Price Index, which excludes volatile food and energy prices, is seen as the more influential measure of inflation in terms of Fed positioning. The index is forecast to rise 0.3% on a monthly basis in March, matching February’s increase. 

Read more

Forex MAJORS

Cryptocurrencies

Signatures