WTI Price Analysis: 100-SMA probes Oil bears around $79.00


  • WTI takes offers to refresh intraday low, extends Friday’s loss.
  • Failure to cross previous support line, downbeat oscillators keep Oil bears hopeful.
  • Key SMAs restrict immediate downside as RSI approaches oversold territory.

WTI crude oil remains on the back foot for the second consecutive day after reversing from a one-week high the previous day, down 0.30% intraday near $79.30 heading into Monday’s European session.

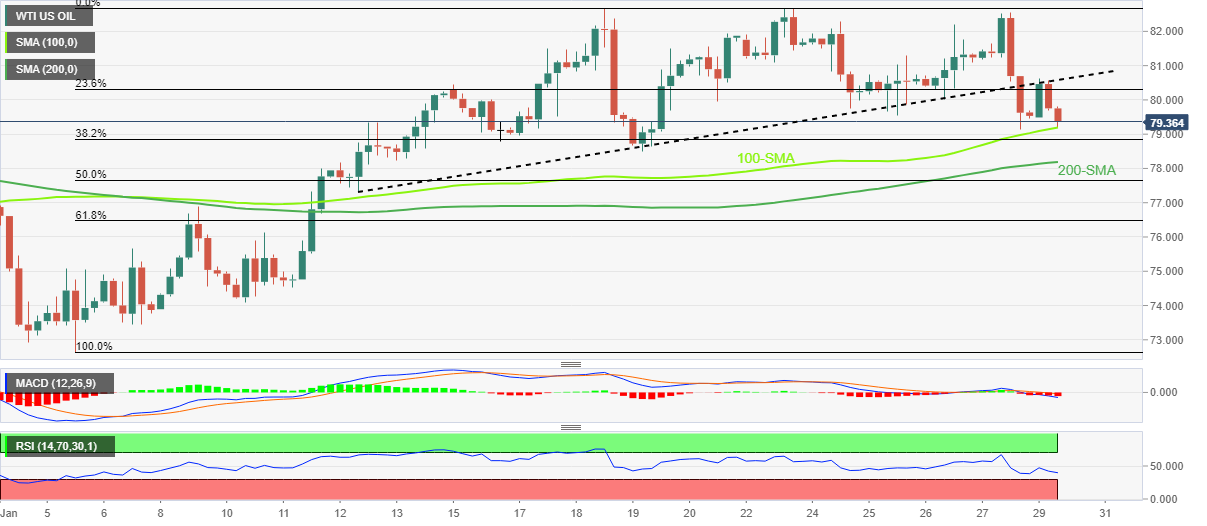
In doing so, the black gold pokes the 100-bar Simple Moving Average (SMA), around $79.20 by the press time.

The energy benchmark’s weakness could be linked to the quote’s early Asian session failure to cross the support-turned-resistance from January 12. Adding strength to the bearish bias could be the downbeat MACD signals, as well as descending RSI (14) line.

It’s worth noting, however, that the downside break of the 100-SMA level of $79.20 may have a tough time in pleasing the Oil bears as the $79.00 threshold and the 200-SMA, close to $78.15, could challenge the quote’s further downside.

In a case where the WTI drops below $78.15, a slump toward the early-month swing high near $76.90 can’t be ruled out.

Alternatively, recovery moves need to cross the previous support line surrounding $80.60 to convince Oil buyers.

Even so, multiple tops around $82.65-70 appear the key hurdle for the WTI bulls to cross to convince markets.

Overall, WTI crude oil is likely to decline further but the downside room appears limited.

WTI: Four-hour chart

Trend: Limited downside expected

Additional important levels

Overview
Today last price 79.27
Today Daily Change -0.26
Today Daily Change % -0.33%
Today daily open 79.53
 
Trends
Daily SMA20 78.58
Daily SMA50 77.84
Daily SMA100 81.61
Daily SMA200 91.4
 
Levels
Previous Daily High 82.56
Previous Daily Low 79.15
Previous Weekly High 82.68
Previous Weekly Low 79.15
Previous Monthly High 83.3
Previous Monthly Low 70.27
Daily Fibonacci 38.2% 80.45
Daily Fibonacci 61.8% 81.26
Daily Pivot Point S1 78.27
Daily Pivot Point S2 77.01
Daily Pivot Point S3 74.87
Daily Pivot Point R1 81.68
Daily Pivot Point R2 83.82
Daily Pivot Point R3 85.08


Share: Feed news

Information on these pages contains forward-looking statements that involve risks and uncertainties. Markets and instruments profiled on this page are for informational purposes only and should not in any way come across as a recommendation to buy or sell in these assets. You should do your own thorough research before making any investment decisions. FXStreet does not in any way guarantee that this information is free from mistakes, errors, or material misstatements. It also does not guarantee that this information is of a timely nature. Investing in Open Markets involves a great deal of risk, including the loss of all or a portion of your investment, as well as emotional distress. All risks, losses and costs associated with investing, including total loss of principal, are your responsibility. The views and opinions expressed in this article are those of the authors and do not necessarily reflect the official policy or position of FXStreet nor its advertisers. The author will not be held responsible for information that is found at the end of links posted on this page.

If not otherwise explicitly mentioned in the body of the article, at the time of writing, the author has no position in any stock mentioned in this article and no business relationship with any company mentioned. The author has not received compensation for writing this article, other than from FXStreet.

FXStreet and the author do not provide personalized recommendations. The author makes no representations as to the accuracy, completeness, or suitability of this information. FXStreet and the author will not be liable for any errors, omissions or any losses, injuries or damages arising from this information and its display or use. Errors and omissions excepted.

The author and FXStreet are not registered investment advisors and nothing in this article is intended to be investment advice.

Recommended content


Recommended content

Editors’ Picks

EUR/USD edges lower toward 1.0700 post-US PCE

EUR/USD edges lower toward 1.0700 post-US PCE

EUR/USD stays under modest bearish pressure but manages to hold above 1.0700 in the American session on Friday. The US Dollar (USD) gathers strength against its rivals after the stronger-than-forecast PCE inflation data, not allowing the pair to gain traction.

EUR/USD News

GBP/USD retreats to 1.2500 on renewed USD strength

GBP/USD retreats to 1.2500 on renewed USD strength

GBP/USD lost its traction and turned negative on the day near 1.2500. Following the stronger-than-expected PCE inflation readings from the US, the USD stays resilient and makes it difficult for the pair to gather recovery momentum.

GBP/USD News

Gold struggles to hold above $2,350 following US inflation

Gold struggles to hold above $2,350 following US inflation

Gold turned south and declined toward $2,340, erasing a large portion of its daily gains, as the USD benefited from PCE inflation data. The benchmark 10-year US yield, however, stays in negative territory and helps XAU/USD limit its losses. 

Gold News

Bitcoin Weekly Forecast: BTC’s next breakout could propel it to $80,000 Premium

Bitcoin Weekly Forecast: BTC’s next breakout could propel it to $80,000

Bitcoin’s recent price consolidation could be nearing its end as technical indicators and on-chain metrics suggest a potential upward breakout. However, this move would not be straightforward and could punish impatient investors. 

Read more

Week ahead – Hawkish risk as Fed and NFP on tap, Eurozone data eyed too

Week ahead – Hawkish risk as Fed and NFP on tap, Eurozone data eyed too

Fed meets on Wednesday as US inflation stays elevated. Will Friday’s jobs report bring relief or more angst for the markets? Eurozone flash GDP and CPI numbers in focus for the Euro.

Read more

Forex MAJORS

Cryptocurrencies

Signatures