- Prices of WTI extend the rally to levels above $59.00.
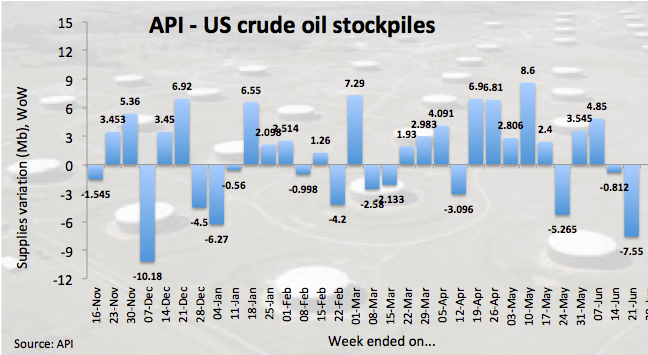
- The API reported a 7.77M barrels drop in US crude supplies.
- The weekly report by the EIA is coming up next.
The rally in crude prices remains everything but abated so far today, lifting the barrel of the American reference for the sweet light crude oil to fresh tops in the area beyond the $59.00 mark.
WTI now looks to EIA report
The relentless up move in prices of the West Texas Intermediate gathered extra wings today after the American Petroleum Institute (API) reported late on Tuesday a reduction of 7.55M barrel in US crude oil supplies during last week.
In addition, prices met extra oxygen after the White House recently announced new sanctions against Iran, aggravating the situation of the oil industry in the OPEC member.
Also collaborating with the up move in prices, somewhat diminshing concerns on the US-China trade conflict have given extra support to the risk-complex. In this regard, the upcoming G-20 event has gained further relevance on the back of the probable Trump-Xi meeting.
Moving forward, the EIA will publish its weekly report on US crude oil inventories ahead of Friday’s oil rig count by driller Baker Hughes.
What to look for around WTI
Geopolitical jitters around the US and Iran remain nonstop for the time being and keep sustaining the upside momentum in crude oil prices. In fact, tensions between both countries are seen escalating in the very near term following the new round of US sanctions, targeting both country and officials and including the Supreme Leader Ali Khamenei. The potential meeting between Trump and China’s Xi at the G-20 event could lend extra legs to the rally if some progress on the trade front is signalled. Also bolstering the upbeat sentiment among traders are the tight US market, the OPEC+ agreement to curb oil production and the so-called ‘Saudi put’.
WTI significant levels
At the moment the barrel of WTI is advancing 0.92% at $59.10 and a breakout of $59.48 (55-day SMA) would aim for $60.73 (23.6% Fibo of the December-April rally) and finally $63.79 (monthly high May 20). On the flip side, the next down barrier arises at $57.19 (38.2% Fibo of the December-April rally) seconded by $54.50 (21-day SMA) and finally $50.54 (monthly low Jun.5).
Information on these pages contains forward-looking statements that involve risks and uncertainties. Markets and instruments profiled on this page are for informational purposes only and should not in any way come across as a recommendation to buy or sell in these assets. You should do your own thorough research before making any investment decisions. FXStreet does not in any way guarantee that this information is free from mistakes, errors, or material misstatements. It also does not guarantee that this information is of a timely nature. Investing in Open Markets involves a great deal of risk, including the loss of all or a portion of your investment, as well as emotional distress. All risks, losses and costs associated with investing, including total loss of principal, are your responsibility. The views and opinions expressed in this article are those of the authors and do not necessarily reflect the official policy or position of FXStreet nor its advertisers. The author will not be held responsible for information that is found at the end of links posted on this page.
If not otherwise explicitly mentioned in the body of the article, at the time of writing, the author has no position in any stock mentioned in this article and no business relationship with any company mentioned. The author has not received compensation for writing this article, other than from FXStreet.
FXStreet and the author do not provide personalized recommendations. The author makes no representations as to the accuracy, completeness, or suitability of this information. FXStreet and the author will not be liable for any errors, omissions or any losses, injuries or damages arising from this information and its display or use. Errors and omissions excepted.
The author and FXStreet are not registered investment advisors and nothing in this article is intended to be investment advice.
Recommended content
Editors’ Picks
EUR/USD holds above 1.0700 ahead of key US data
EUR/USD trades in a tight range above 1.0700 in the early European session on Friday. The US Dollar struggles to gather strength ahead of key PCE Price Index data, the Fed's preferred gauge of inflation, and helps the pair hold its ground.
USD/JPY stays above 156.00 after BoJ Governor Ueda's comments
USD/JPY holds above 156.00 after surging above this level with the initial reaction to the Bank of Japan's decision to leave the policy settings unchanged. BoJ Governor said weak Yen was not impacting prices but added that they will watch FX developments closely.
Gold price oscillates in a range as the focus remains glued to the US PCE Price Index
Gold price struggles to attract any meaningful buyers amid the emergence of fresh USD buying. Bets that the Fed will keep rates higher for longer amid sticky inflation help revive the USD demand.
Sei Price Prediction: SEI is in the zone of interest after a 10% leap
Sei price has been in recovery mode for almost ten days now, following a fall of almost 65% beginning in mid-March. While the SEI bulls continue to show strength, the uptrend could prove premature as massive bearish sentiment hovers above the altcoin’s price.
US core PCE inflation set to signal firm price pressures as markets delay Federal Reserve rate cut bets
The core PCE Price Index, which excludes volatile food and energy prices, is seen as the more influential measure of inflation in terms of Fed positioning. The index is forecast to rise 0.3% on a monthly basis in March, matching February’s increase.