When is the US CPI report and how could it affect EUR/USD?

US June CPI Overview
Wednesday's US economic docket highlights the release of the latest consumer inflation figures, due later during the early North-American session at 12:30GMT. The headline CPI is anticipated to remain flat month-on-month (m/m) in June as compared to a modest rise of 0.1% in the previous month, while the yearly rate is expected to have decelerated to 1.6% from 1.8% in May. On the other hand, core CPI - excluding food and energy costs, is predicted to tick higher to 0.2% m/m rate as against 0.1% rise recorded in April, helping the annual core inflation to hold steady at 2.0%.
As analysts at TD Securities explain - “Core inflation should remain steady at 2.0% y/y, reflecting a firm 0.2% m/m advance. We pencil in a 0.2% m/m increase in core services and a flat reading in core goods, which should help buoy core CPI overall.”
Deviation impact on EUR/USD
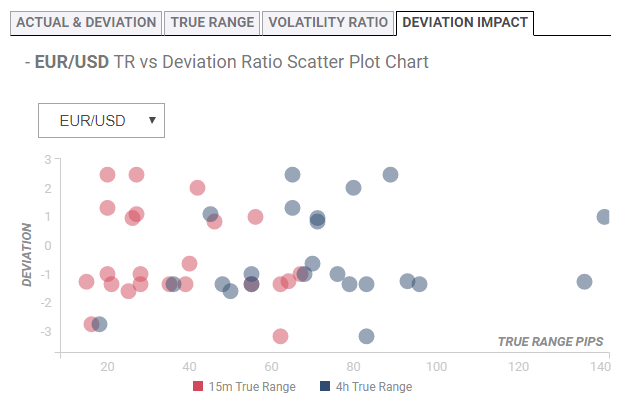
Readers can find FX Street's proprietary deviation impact map of the event below and as observed, the reaction in case of a relative deviation of +0.98 to -0.98 in the core CPI print is likely to be in the range of 26-25 pips during the first 15-minutes and could stretch to 55-71 pips in the following 4-hours.
How could it affect EUR/USD?
Market participants will scrutinize the data for clues over the Fed's near-term monetary policy outlook ahead of the next meeting later this July. A 25 bps rate cut is fully factored in and against the backdrop of the Fed Chair Jerome Powell's dovish testimony on Wednesday, a softer than expected reading will be enough to fuel expectations for an aggressive easing cycle in 2019 and exert some additional pressure on the already weaker US Dollar.
Yohay Elam, FXStreet's own Analyst offered his take on the EUR/USD pair and also provided important technical levels to watch for – “The technical picture for EUR/USD has significantly improved. The world's most popular currency has set a higher low at 1.1195 and has crossed above the 50 and 200 Simple Moving Averages on the four-hour chart. Moreover, momentum has turned positive and the Relative Strength Index is on the rise.”
“The 100 SMA at the round number of 1.1300 may serve as resistance but the more significant caps are higher. 1.1320 capped EUR/USD in early July, while 1.1350 served as support in late June. The next lines to watch are 1.1390 and .11410. Some support awaits at 1.1270 which held up EUR/USD last week. It is followed by 1.1235 which held it down earlier this week and by the weekly low of 1.1195,” he added further.
Key Notes
• US CPI Preview: Inflation is secondary
• Powell's Power Play: Fed's five dollar downers – EUR/USD levels to watch
About the US CPI
The Consumer Price Index released by the US Bureau of Labor Statistics is a measure of price movements by the comparison between the retail prices of a representative shopping basket of goods and services. The purchasing power of USD is dragged down by inflation. The CPI is a key indicator to measure inflation and changes in purchasing trends. Generally speaking, a high reading is seen as positive (or bullish) for the USD, while a low reading is seen as negative (or Bearish).
Author

Haresh Menghani
FXStreet
Haresh Menghani is a detail-oriented professional with 10+ years of extensive experience in analysing the global financial markets.


