Litecoin Price Forecast: LTC struggles to extend gains, bullish bets at risk
- Litecoin trades above $80, finding it hard to extend an upcycle in a larger falling wedge pattern.
- Rising bullish bets amid declining Open Interest warn of a potential long squeeze.
- The technical outlook for Litecoin suggests further extension of the reversal from the $87 resistance level could be on the cards.

Litecoin (LTC) price steadies above $80 at press time on Friday, following a reversal from the $87 resistance level on Wednesday. Derivatives data suggests a bullish positional buildup while the LTC futures Open Interest declines, flashing a long squeeze risk. Litecoin’s struggle to exceed $87 could result in a pullback below $80 within a broader descending wedge pattern.
Fresh bullish bets at risk as retail demand falters
CoinGlass data shows a broadly flat movement in Litecoin futures Open Interest (OI), standing at $397.18 million on Friday, down from $409.27 million the previous day. This reflects a decline in the notional value of all active positions, including long and short positions, signaling reduced risk exposure among investors.
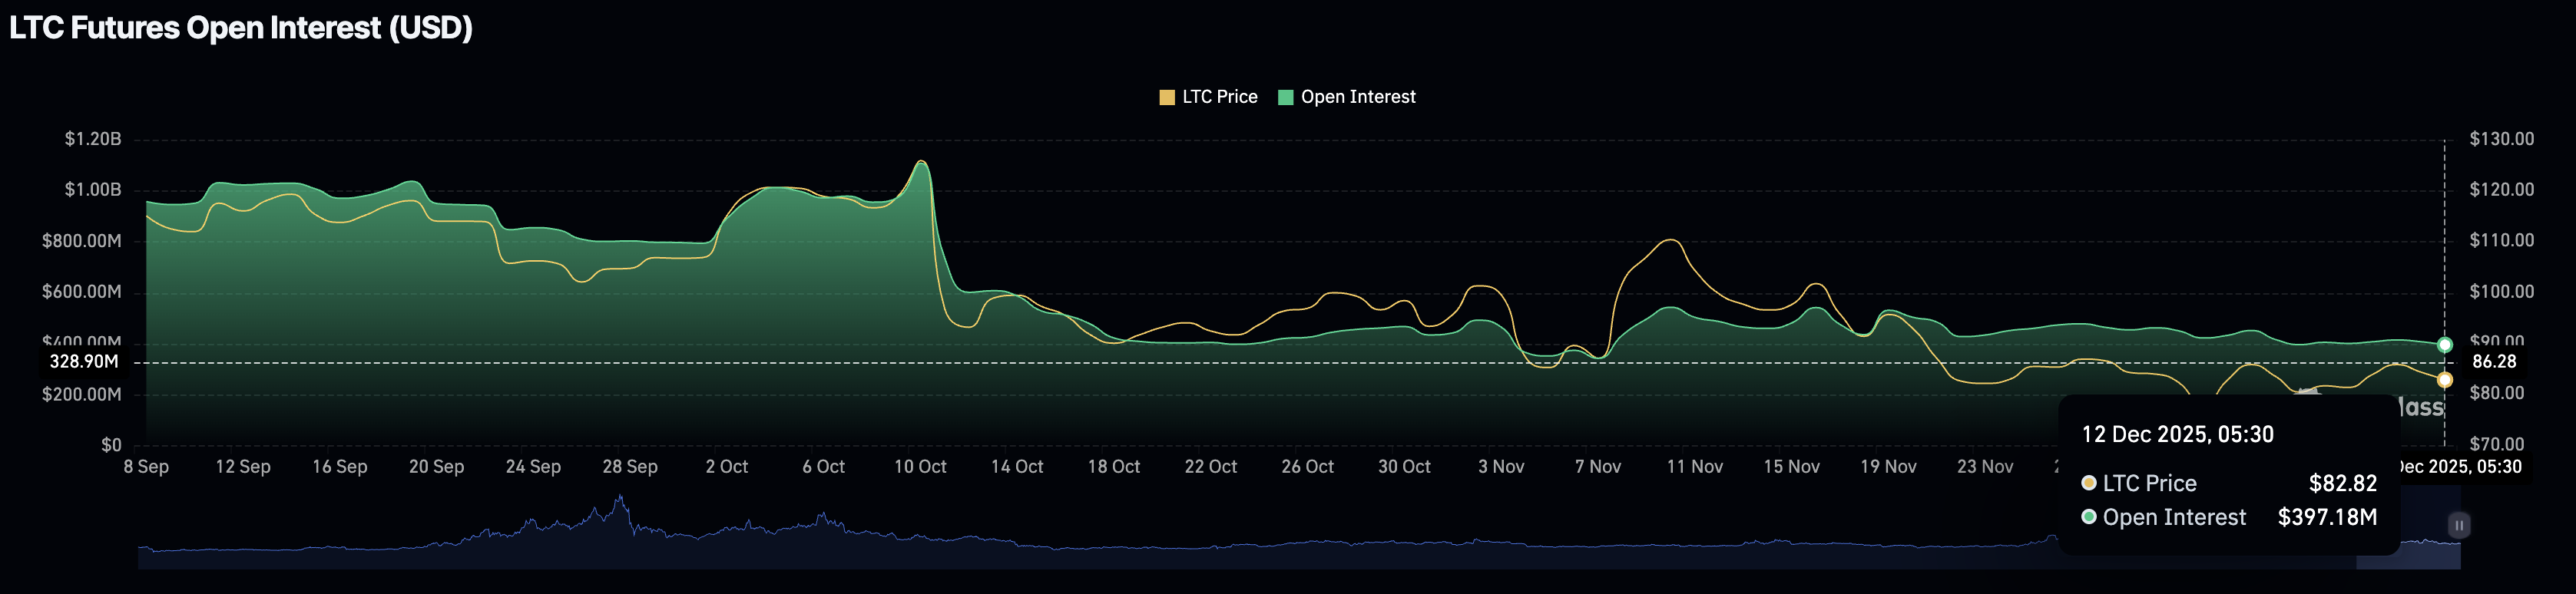
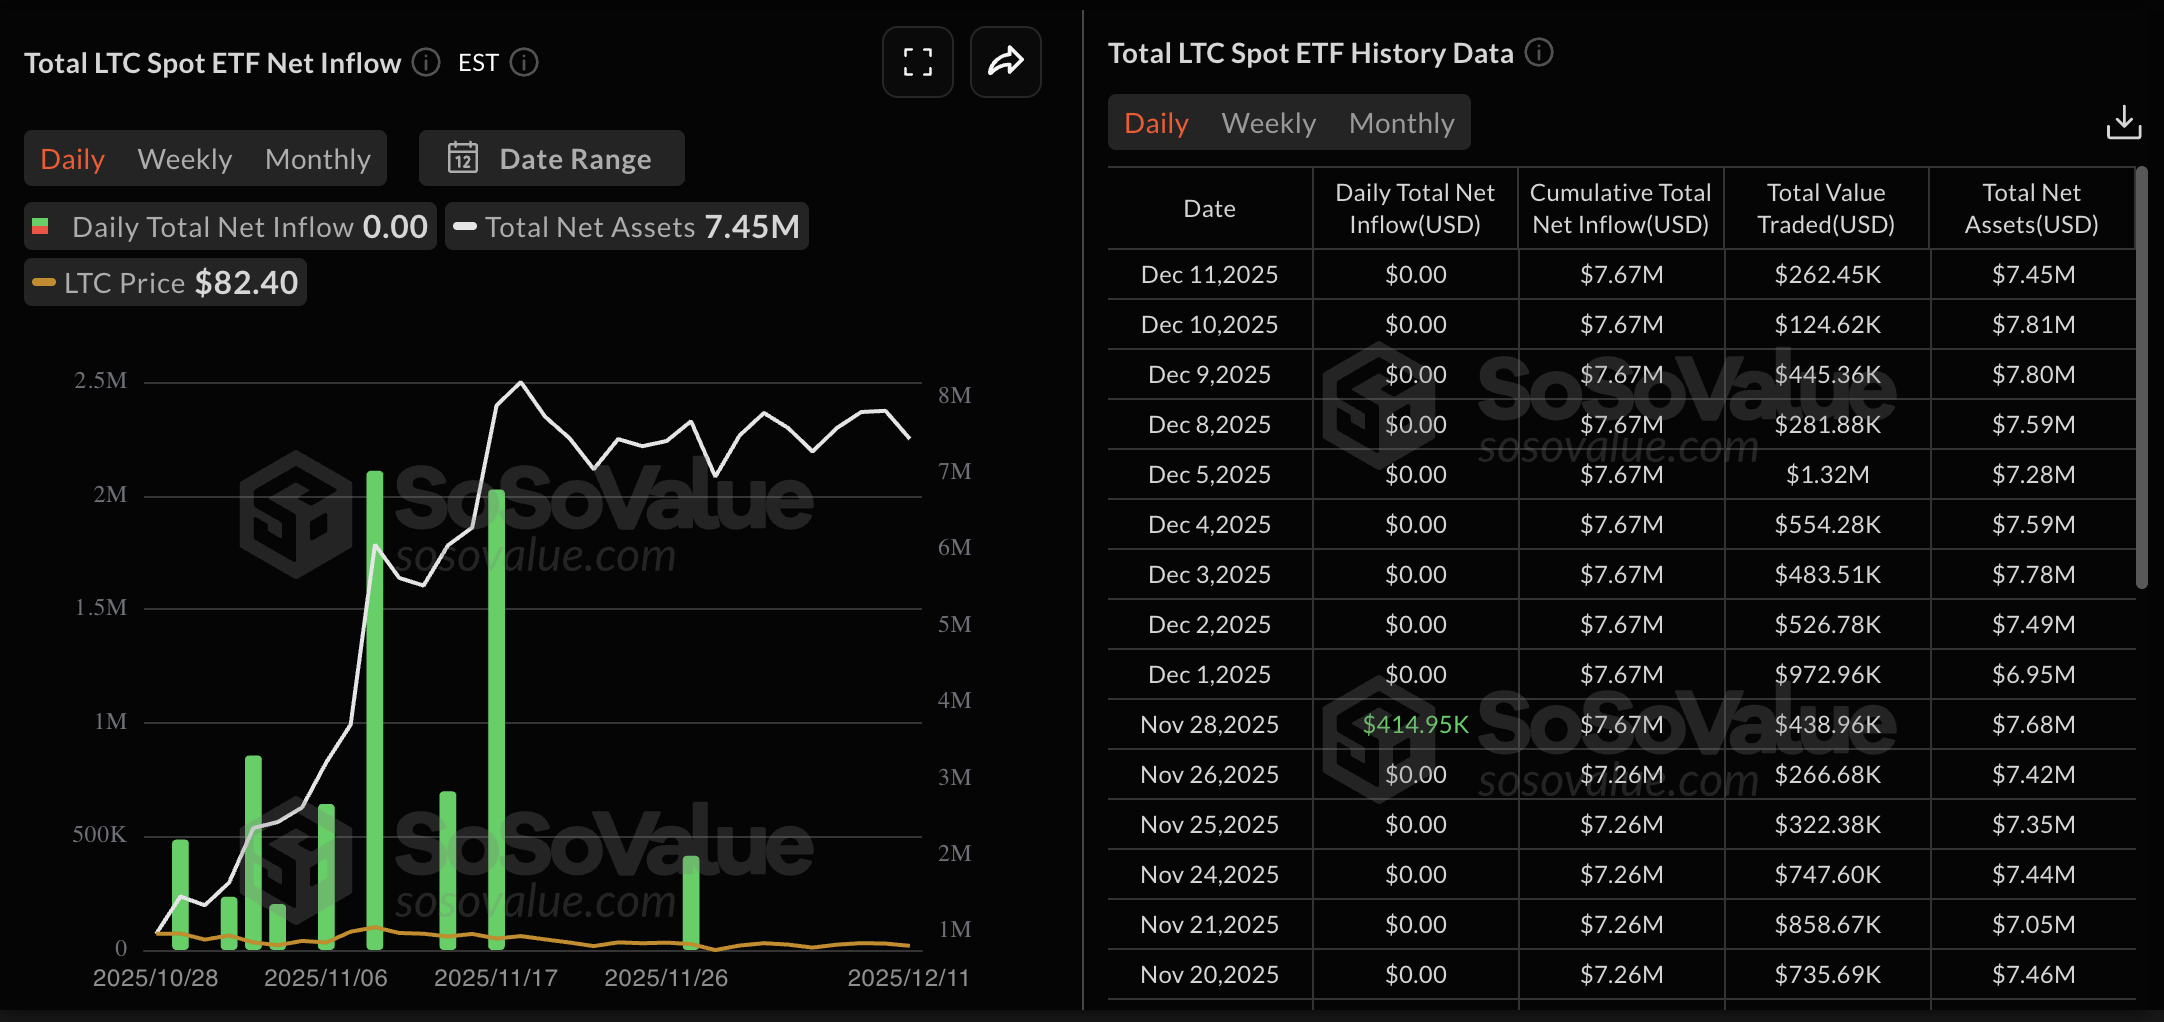
In line with this, the institutional interest in Litecoin is dull, as, according to Sosovalue, Canary Capital’s LTC-focused Exchange Traded Fund (ETF) has seen nine consecutive days of net-zero flows.
Still, the OI-weighted funding rate at 0.0071% suggests an increase in bullish confidence. Furthermore, the long-to-short ratio shows that out of all active positions, 51.27% are longs, up from 46.68% on the previous day.
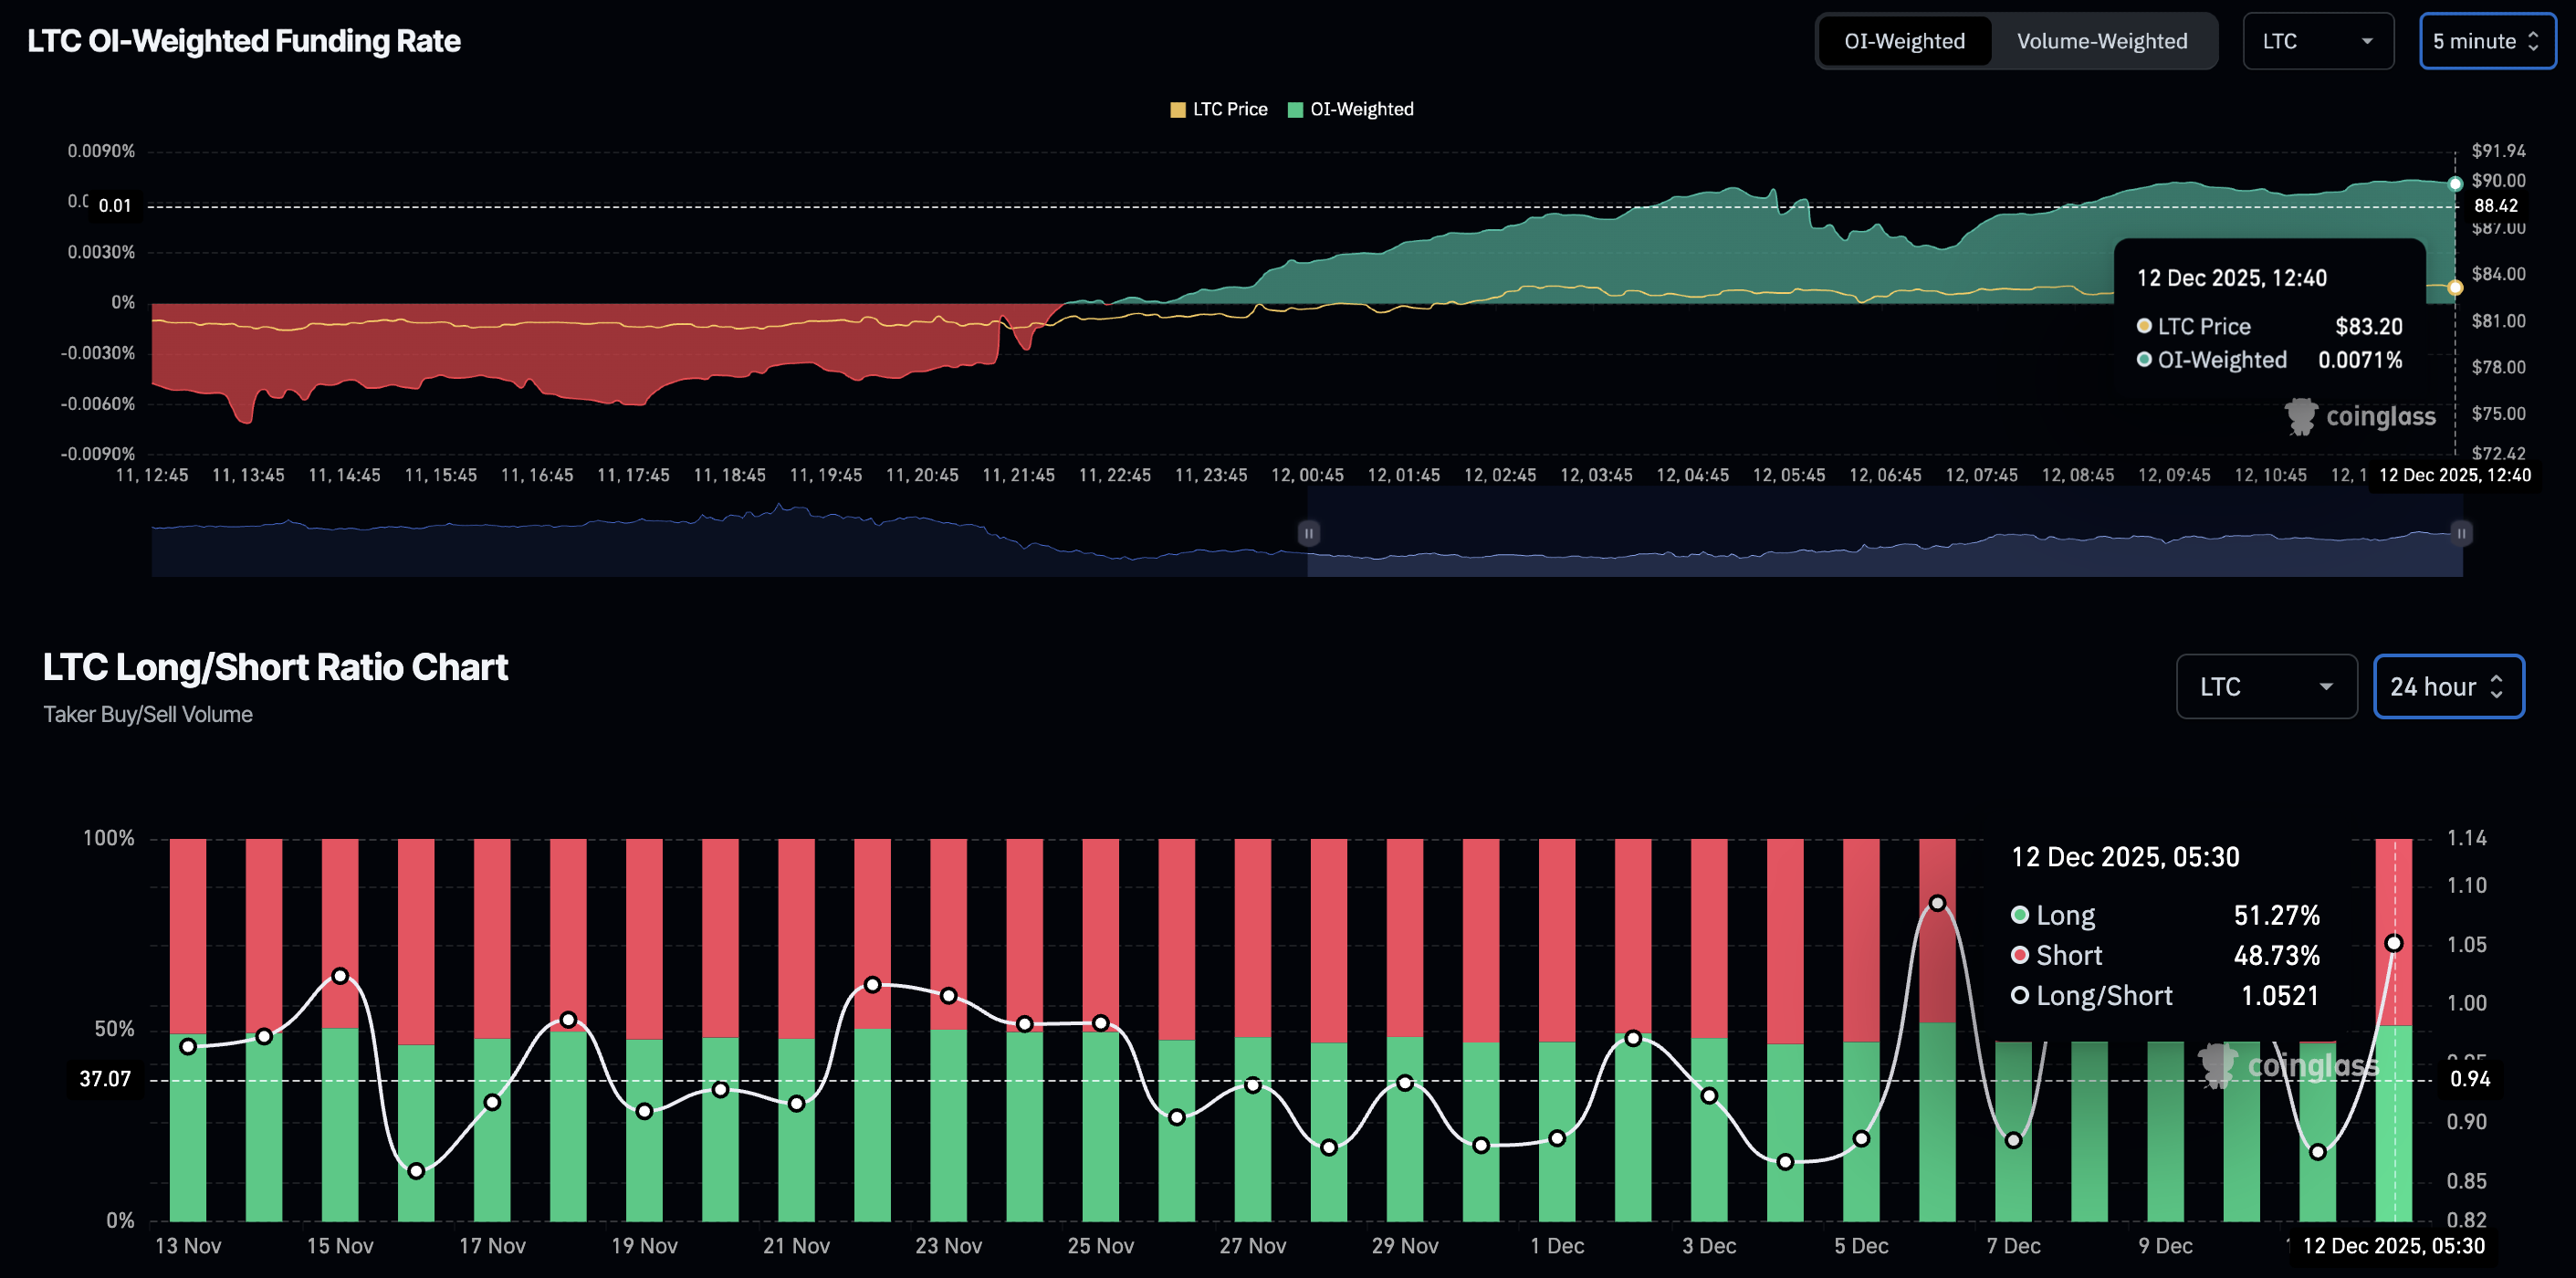
Typically, a surge in long positions during declining retail interest increases the risk of forced liquidations. Such market structures could lead to a loop of declining prices and long liquidations, known as a long squeeze.
Litecoin could lose hold above $80
Litecoin struggles to extend gains above the $87 level within a broader falling wedge pattern (formed by connecting two descending but converging trendlines) on the daily logarithmic chart. The ongoing struggle risks a pullback below $80 to test the lower support trendline connecting the October 17 and November 4 lows, near the S1 Pivot Point at $70.
Technically, the momentum indicators on the daily chart are balanced near neutral levels. The Relative Strength Index (RSI) at 45 shows room to the downside for steady correction before reaching the oversold zone.
Additionally, the Moving Average Convergence Divergence (MACD) is losing the uptrend momentum, inching closer to the signal line as green histogram bars shrink. If the MACD crosses below the signal line, resulting in a red histogram bar below the zero line, it would indicate a bearish shift in trend momentum.
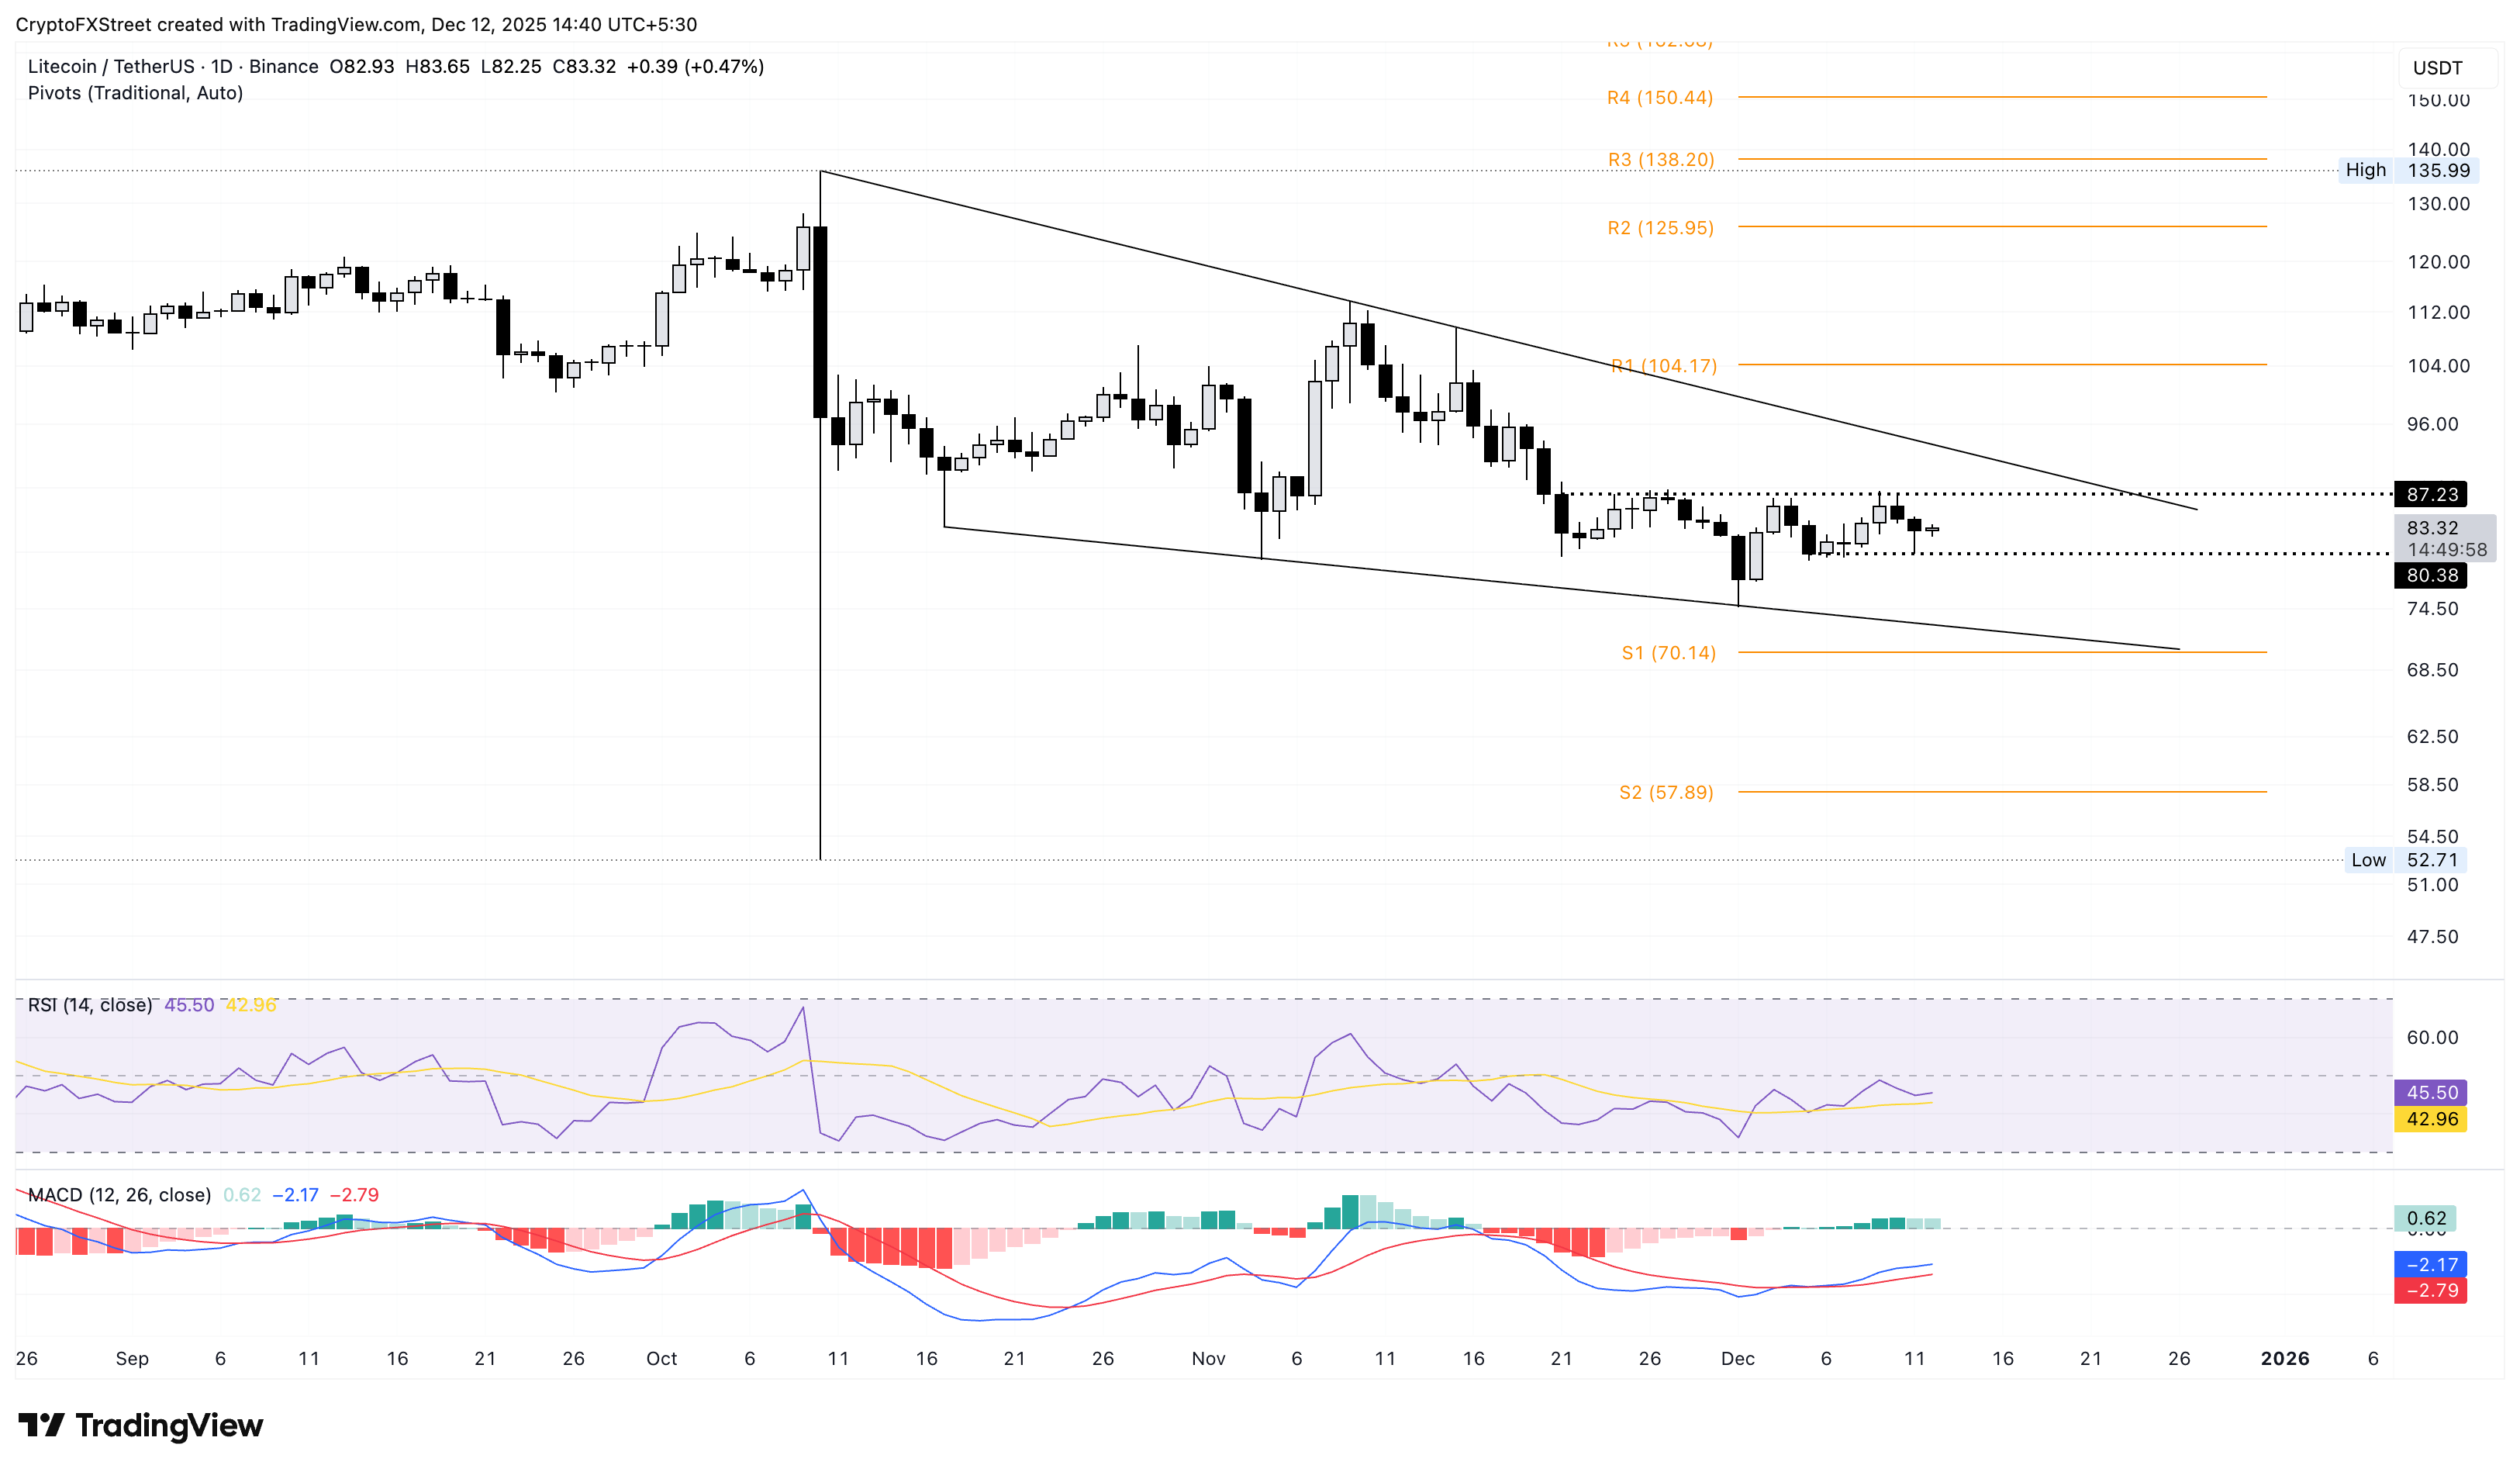
On the contrary, if Litecoin breaks above $87, it could aim for the overhead resistance trendline near $90. In case LTC exceeds $90, the R1 Pivot Point at $104 could serve as the initial target.
Author

Vishal Dixit
FXStreet
Vishal Dixit holds a B.Sc. in Chemistry from Wilson College but found his true calling in the world of crypto.


