Dow Jones Industrial Average retreats from record highs but poised for weekly gain
- The Dow Jones fell back from record highs on Friday as tech stocks weaken.
- Despite weakness, the Dow is bucking the trend and headed for a weekly gain.
- Investors continue to quietly unwind their AI bets and rotate into growth stocks.

The Dow Jones Industrial Average (DJIA) retreated from record intraday highs on Friday alongside its major index peers as investors continued rotating out of technology and into value-oriented sectors. The Dow briefly hit a new intraday record before pulling back 0.30%. Despite some deflation in the US tech space in the back half of the trading week, the Dow is on pace to finish the week on a high note, up 1.26% from Monday’s initial bids.
The S&P 500 (SP500) fell 0.8%, and the Nasdaq also dropped 1.3%, weighed down by a sharp 10% decline in Broadcom (AVGO) following concerns about margin pressures despite strong earnings and an upbeat outlook for artificial intelligence chips.
AI techs continue to wither
The unwind of the artificial intelligence trade broadened, with AMD, Palantir Technologies (PLTR), and Micron (MU) also trading lower. In contrast, financials, health care, and industrials attracted buying interest. Visa (V), Mastercard (MA), UnitedHealth Group (UNH), and GE Aerospace (GE) were among the key gainers. Lululemon (LULU) surged 10% after announcing its chief executive officer will step down at the end of January.
Friday’s session extended the rotation theme that accelerated after the Federal Reserve’s (Fed) third straight rate cut of the year on Wednesday. This shift drove value and cyclical stocks higher earlier in the week, lifting the Dow and S&P 500 to record closes while the Nasdaq lagged on weakness in Alphabet (GOOG), Nvidia (NVDA), and other high-growth names. Small-capitalization stocks continued to outperform, with the Russell 2000 up more than 1% for the week and setting fresh highs.
Policymakers push the envelope on rate consensus dissent
Chicago Federal Reserve President Austan Goolsbee said he opposed this week’s rate cut, arguing that policymakers should have waited for more data before moving again. He expressed confidence that rates could be lower in 2026 but voiced discomfort with “front-loading” easing while inflation progress remains uncertain. His dissent, alongside those of Kansas City Fed President Jeffrey Schmid and Governor Stephen Miran, added nuance to the policy backdrop as markets reassessed growth and valuation dynamics.
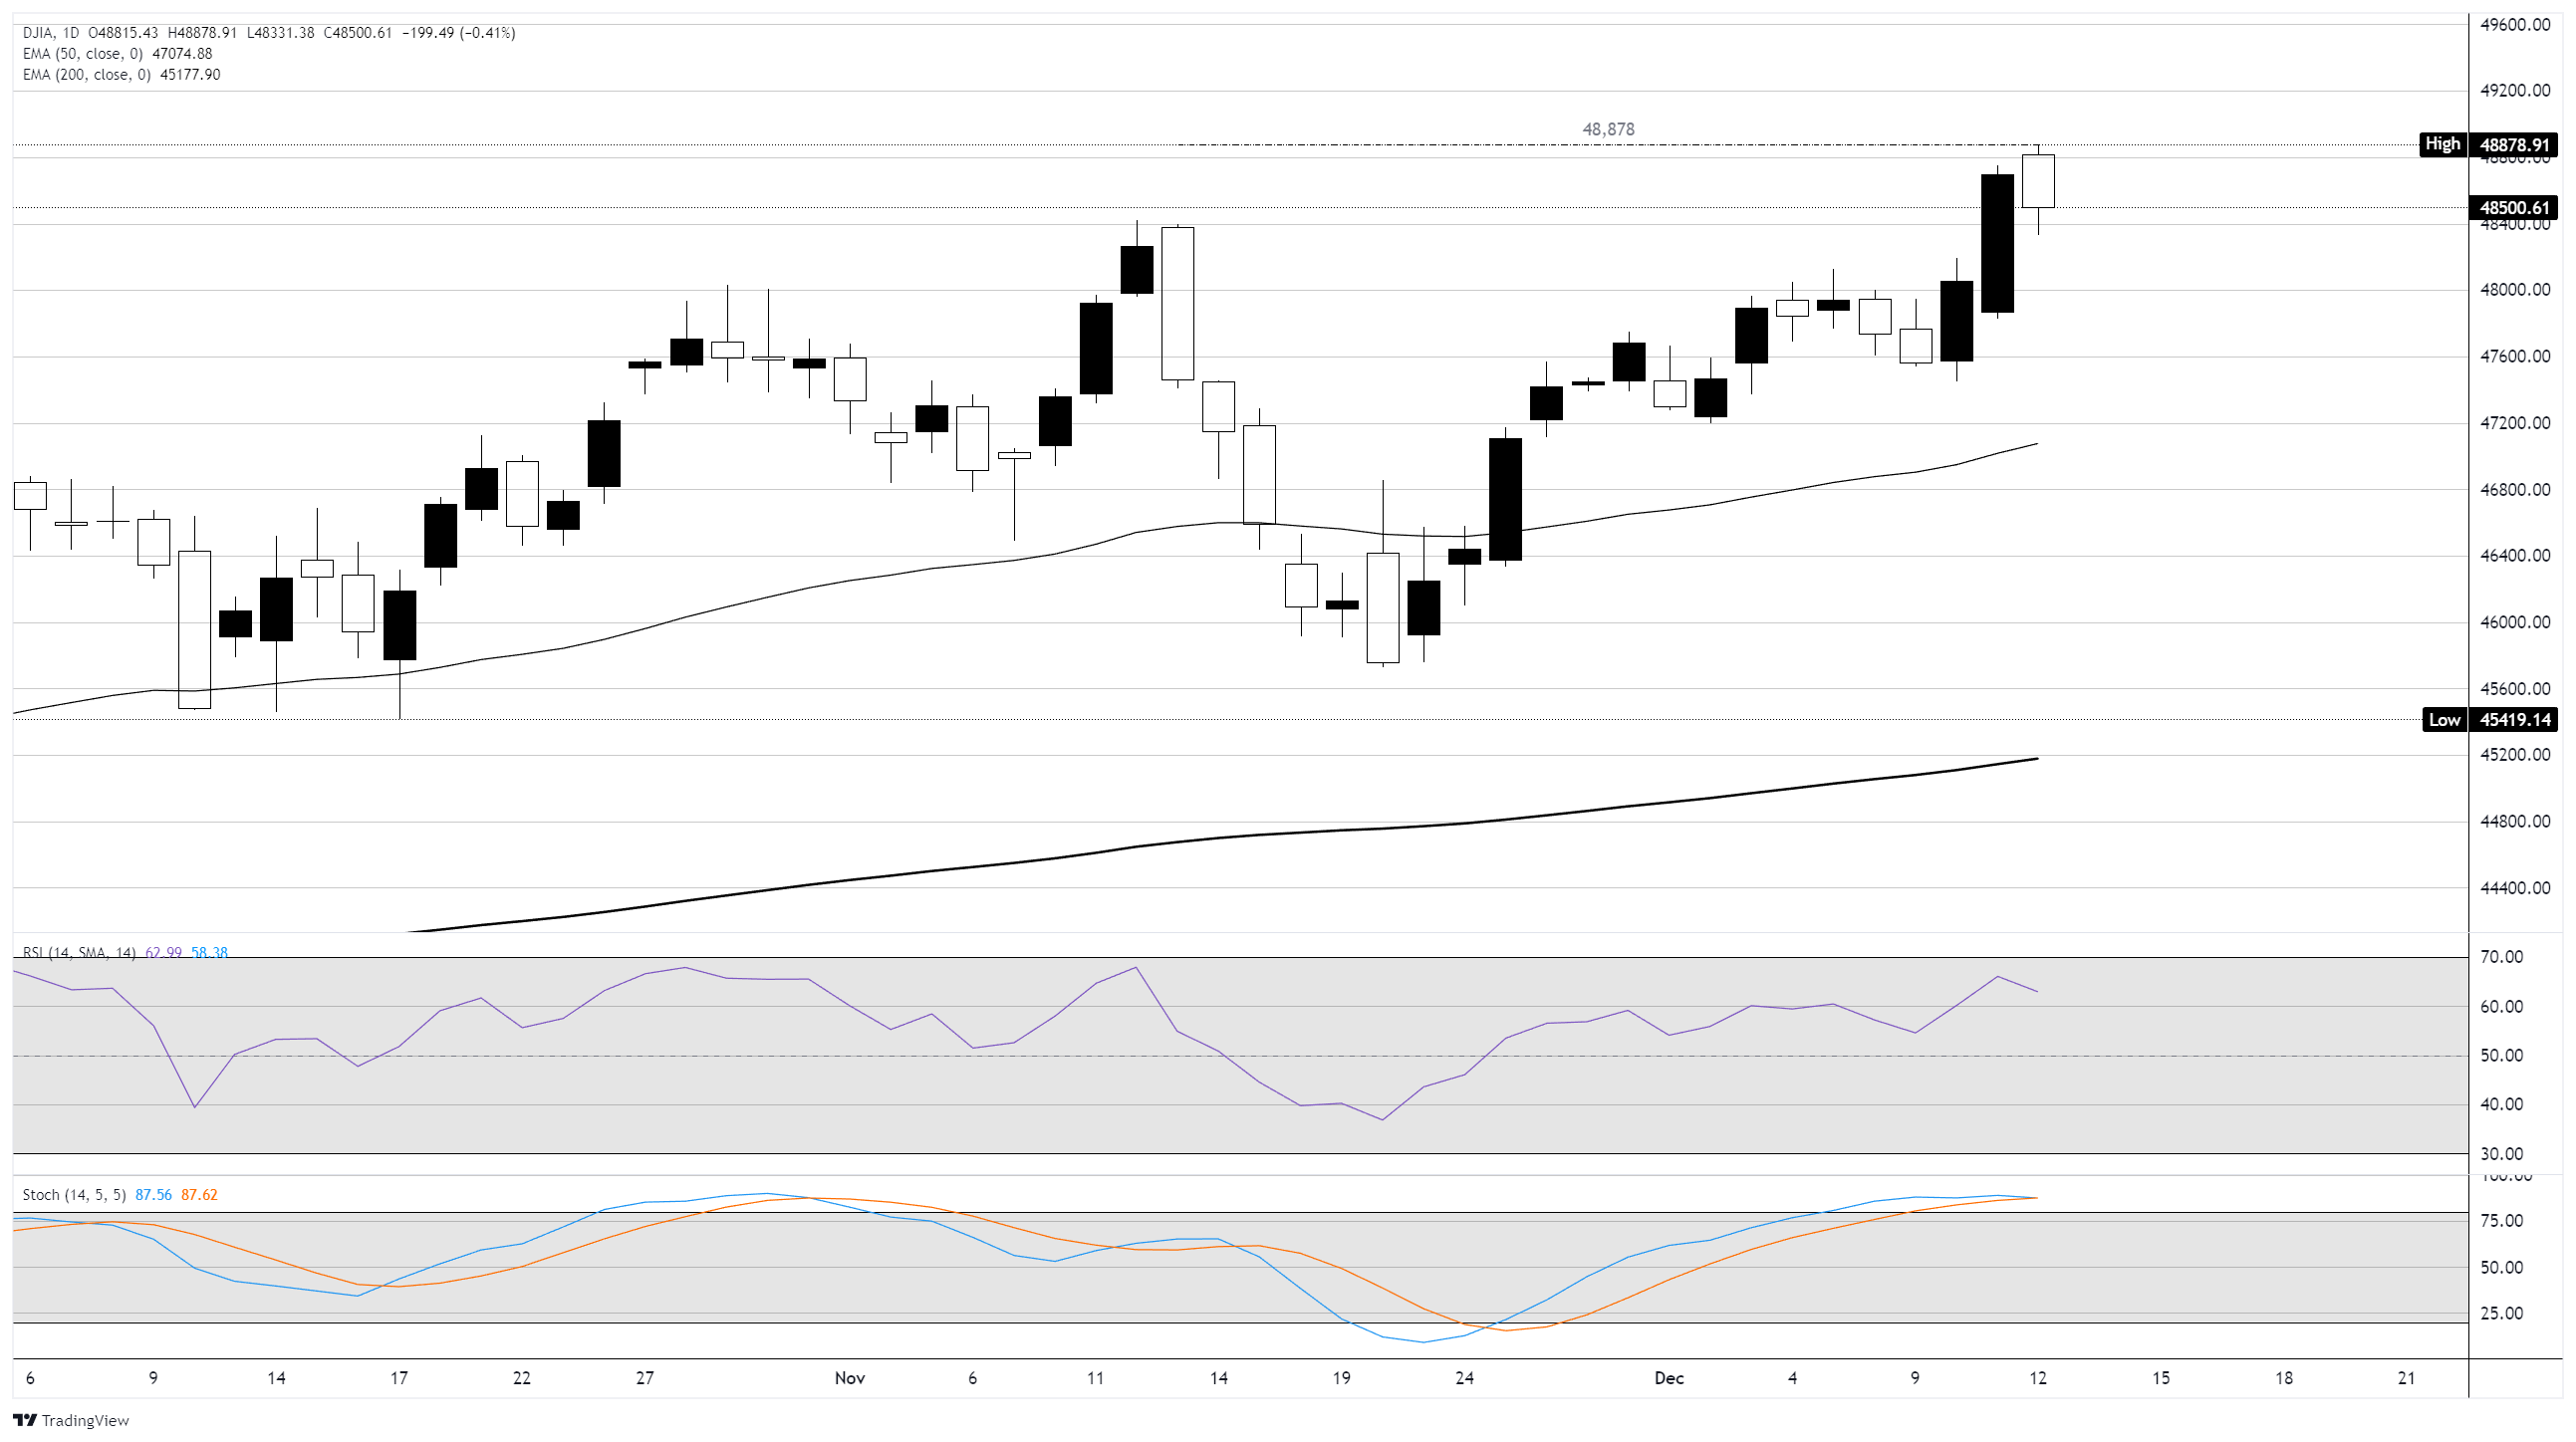
Dow Jones daily chart
Dow Jones FAQs
The Dow Jones Industrial Average, one of the oldest stock market indices in the world, is compiled of the 30 most traded stocks in the US. The index is price-weighted rather than weighted by capitalization. It is calculated by summing the prices of the constituent stocks and dividing them by a factor, currently 0.152. The index was founded by Charles Dow, who also founded the Wall Street Journal. In later years it has been criticized for not being broadly representative enough because it only tracks 30 conglomerates, unlike broader indices such as the S&P 500.
Many different factors drive the Dow Jones Industrial Average (DJIA). The aggregate performance of the component companies revealed in quarterly company earnings reports is the main one. US and global macroeconomic data also contributes as it impacts on investor sentiment. The level of interest rates, set by the Federal Reserve (Fed), also influences the DJIA as it affects the cost of credit, on which many corporations are heavily reliant. Therefore, inflation can be a major driver as well as other metrics which impact the Fed decisions.
Dow Theory is a method for identifying the primary trend of the stock market developed by Charles Dow. A key step is to compare the direction of the Dow Jones Industrial Average (DJIA) and the Dow Jones Transportation Average (DJTA) and only follow trends where both are moving in the same direction. Volume is a confirmatory criteria. The theory uses elements of peak and trough analysis. Dow’s theory posits three trend phases: accumulation, when smart money starts buying or selling; public participation, when the wider public joins in; and distribution, when the smart money exits.
There are a number of ways to trade the DJIA. One is to use ETFs which allow investors to trade the DJIA as a single security, rather than having to buy shares in all 30 constituent companies. A leading example is the SPDR Dow Jones Industrial Average ETF (DIA). DJIA futures contracts enable traders to speculate on the future value of the index and Options provide the right, but not the obligation, to buy or sell the index at a predetermined price in the future. Mutual funds enable investors to buy a share of a diversified portfolio of DJIA stocks thus providing exposure to the overall index.
Author

Joshua Gibson
FXStreet
Joshua joins the FXStreet team as an Economics and Finance double major from Vancouver Island University with twelve years' experience as an independent trader focusing on technical analysis.


