Walmart misses the target as TGT stock suffers 1987-style collapse
- Walmart started the slide as it missed EPS on Tuesday.
- Target then suffered a collapse on Wednesday after it missed.
- Retail stocks led the entire market lower on Wednesday.

First Walmart (WMT) and then Target (TGT) gave us exactly the picture that the retail sales number failed to do. Investors got somewhat excited as the retail sales number looked reasonably strong earlier this week. We had mentioned in our commentary that this was largely due to inflation, and it was a lagged report anyway. However, investors chose to take the positives.
This optimism was dramatically ruptured on Wednesday when Target released earnings and went max bearish on costs and outlook. Walmart had teed this up Tuesday, but Target really rattled cages.
Walmart Earnings
Walmart's revenue number actually topped analyst estimates of $140.3 billion, coming in just over $2 billion ahead of analysts' estimate. Earnings per share (EPS) at $1.30 missed the expected $1.48. Margins were hit by rising costs and led Walmart's CEO to say, "US inflation levels, particularly in food and fuel, created more pressure on margin mix and operating costs than expected. We’re adjusting and will balance the needs of our customers for value with the need to deliver profit growth for our future."
Walmart stock closed 11% lower on Tuesday, pretty bad but not even close to its competitor.
Target Earnings
Walmart put us on notice, but things were about to get really ugly. TGT stock fell the most since the 1987 Black Monday crash. TGT stock ended Wednesday down by 25%. Target also beat on revenue, $25.2 billion versus $24.5 billion expected. Earnings per share though also suffered from lower margins. Rising costs are again to blame here. EPS was $2.19 versus $3.06 expected. Profit margins fell to 6% from 8% previously.
“We were less profitable than we expected to be, or intend to be over time,” CEO Brian Cornell said in a briefing. “Looking ahead, it’s clear that many of these cost pressures will persist in the near term.”
As if things were not bad enough on Wednesday, another retailer cut guidance, citing costs and inflationary concerns. This time it was Bath & Body Works. This does at least set up a contrarian trade possibility for next week. More retailers report next week such as Costco (COST), Dollar General (DG), Best Buy (BBY) and Big Lots (BIG). We are at max bearishness for retail now. Any outperformance or bullish outlooks will see a massive rally in our opinion. The risk reward trade is skewed higher. We all expect more of the same.
Walmart, Target Key Takeaways
Consumer demand is solid. Both companies reported revenue ahead of analyst forecasts. The US consumer is still spending despite rising prices. So far so good. Target did say though that discretionary items saw less interest from consumers who chose instead to focus on lower ticket items. These carry lower margins for retailers. Despite spending holding up, we already are witnessing a shift in consumer spending patterns to lower-cost items. This will continue to hit margins going forward for retailers. Eventually, persistent inflation will lead to consumers cutting back on spending across all areas. Last week's consumer sentiment data from the University of Michigan showed consumer confidence at the lowest level since 2011. Consumers are spending for now, but they know what is coming.
Target Stock Forecast
Get ready for some serious range expansion. As the legend that is Stanley Druckenmiller puts it, when you get range expansion, the market is preparing for a move in that direction. Well off you go, next stop $100 with a stop at $125 on the way. This coming recession now looks more and more likely. Back in 2019 before the pandemic, Target was trading around $80 to $110. That was without a recession!
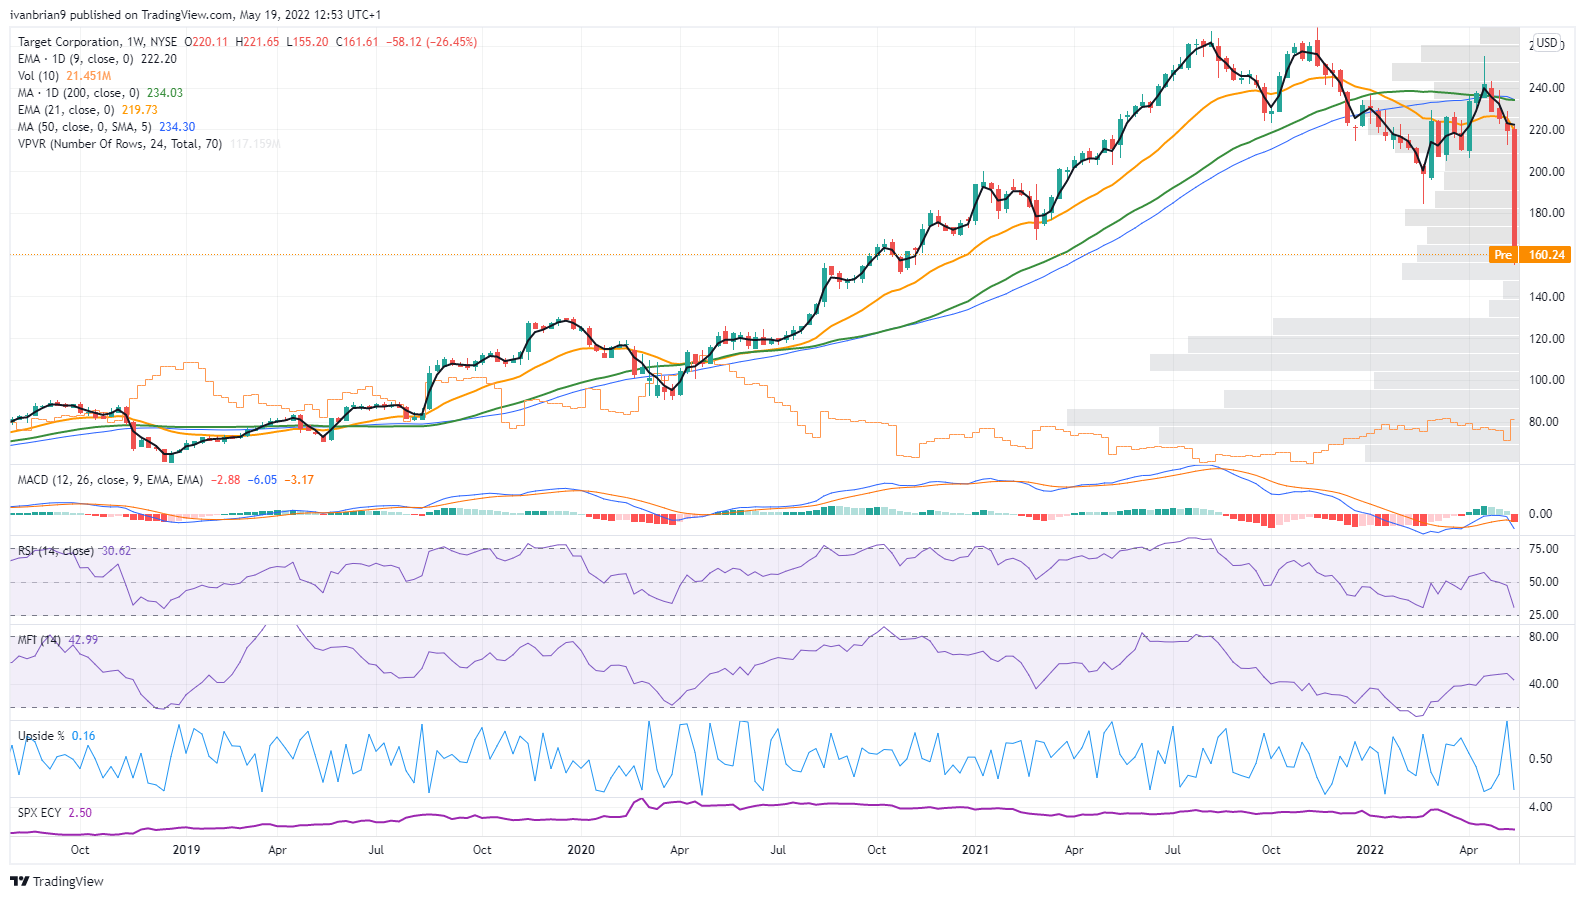
Target (TGT) stock chart, weekly
Walmart Stock Forecast
We can see our first target (excuse the pun) in the March 2020 area marked uncertainty and volatility. WMT will trade toward here. After that, it is less clear. WMT is the king of adapting to the market and to consumer demand. It may be better positioned than most to ride out the coming inflationary recession.
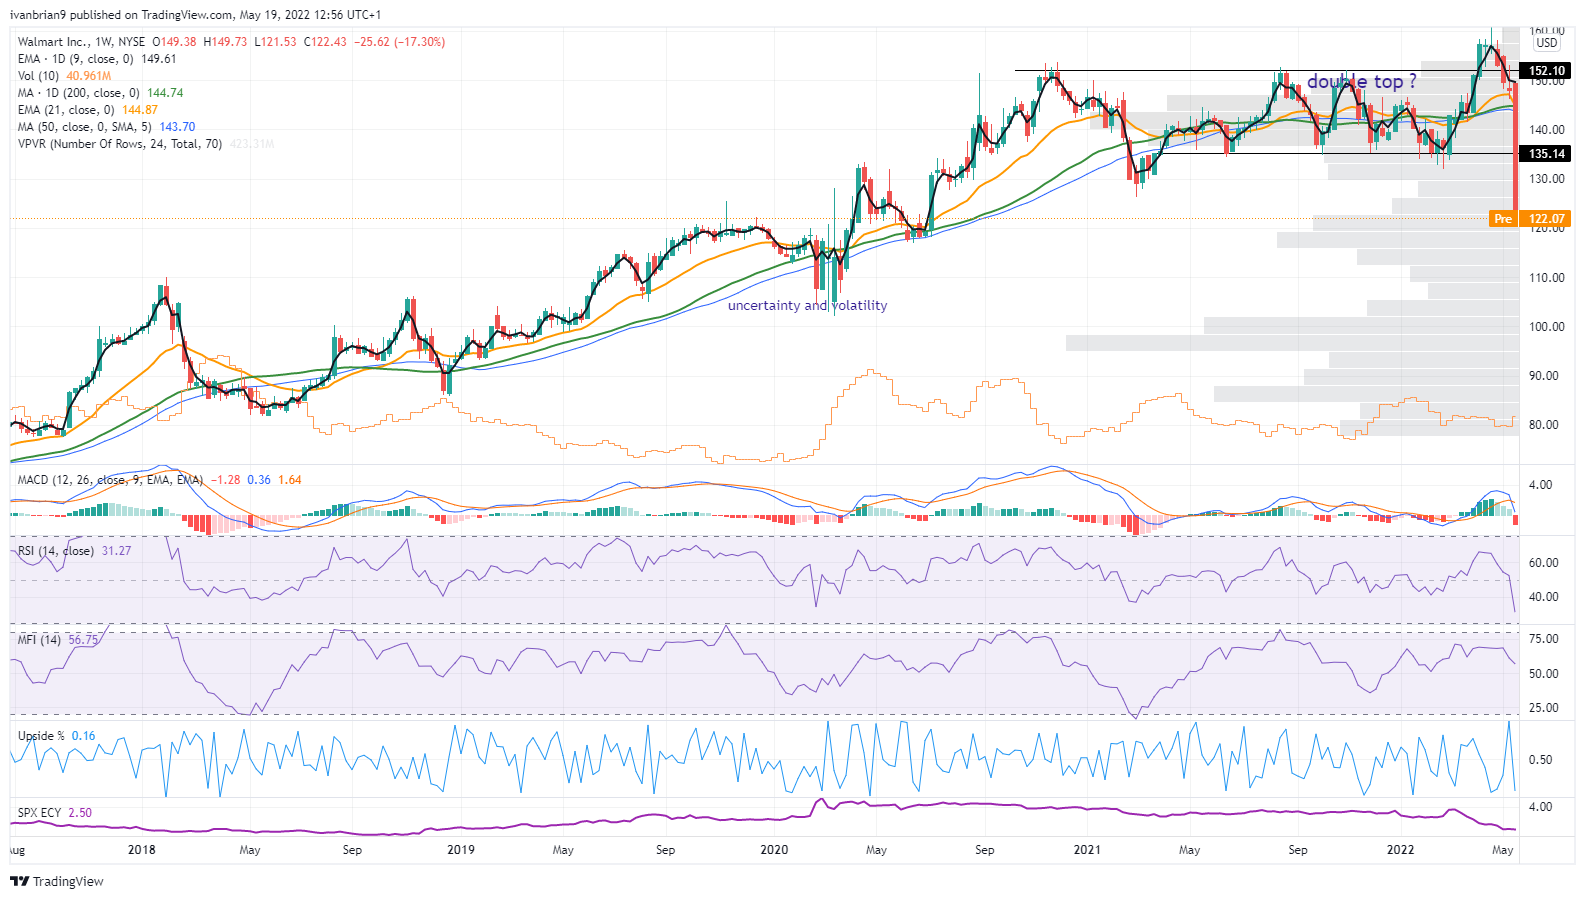
WMT stock chart, daily
Like this article? Help us with some feedback by answering this survey:
Author

Ivan Brian
FXStreet
Ivan Brian started his career with AIB Bank in corporate finance and then worked for seven years at Baxter. He started as a macro analyst before becoming Head of Research and then CFO.


