Visa (V) Stock Deep Dive Analysis: Hold Visa for the long term with a $175 price target

Welcome back to the deep dive series where this time we focus on Visa (V), the global payments company. Perhaps somewhat timely as consumers begin once again to turn to credit in the face of a pending recession and inflation. We will as per usual go through the two gold standard valuation methods – the discounted cash flow analysis (DCF) and a relative valuation framework. The DCF gives us a price target based on growth rates and interest rates and uses such flows forecasted into the future to come up with a present value for the shares. Basically, a discounted cash flow takes current cash flows/revenue and forecasts them into the future using some assumptions about the business and macro backdrop.
We then input the anticipated growth rate based on historical averages for Visa. Finally, we use current interest rates to discount those future cash flows back to the present value. That is why the current obsession with interest rates going up affects the Nasdaq. The higher interest rate means a higher discount of futures cash flows and so a lower valuation. Secondly, we look at the relative valuation. This is the more familiar price/earnings (P/E) ratio. This can be used to see what multiple Visa competitors trade on, versus Mastercard and American Express for example. We can also see how the multiple has performed in recent recessions and economic periods to make assumptions about how the valuation looks historically versus Visa's peer group. So let us dig in.
- Company overview and history
- Wall Street consensus forecasts
- Key valuation rating metrics
- Peer value comparison
- Macroeconomic backdrop, market cycle, and sector analysis
- Recent news and earnings
- Forecast and valuation
- Technical analysis
- Executive summary, recommendation, and price target
Visa (V): Company overview and history
Visa is best known for its credit card business and operates overall as a digital payments business. Visa was founded in 1958 in California and debuted on the stock exchange in 1980. It operates digital payments networks providing seamless payment solutions to banks, businesses and customers via a multitude of financial payment products. The most well-known are Visa, Visa Electron and Plus brands but also include Interlink and VPAY. The company operates globally and is one of the most recognized financial brands in the world. Visa offers customers Visa credit and debit cards as well as prepaid cards. It also operates a global network of ATM machines.
Also read: Tesla Stock Deep Dive: Price target at $400 on China headwinds, margin compression, lower deliveries
Visa was founded by Dee Hock and trades on the New York Stock Exchange under the ticker V.
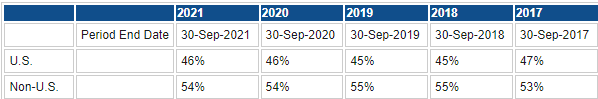
Source: Refinitiv
As we can see the company classifies its revenues by US and the Rest of the World.
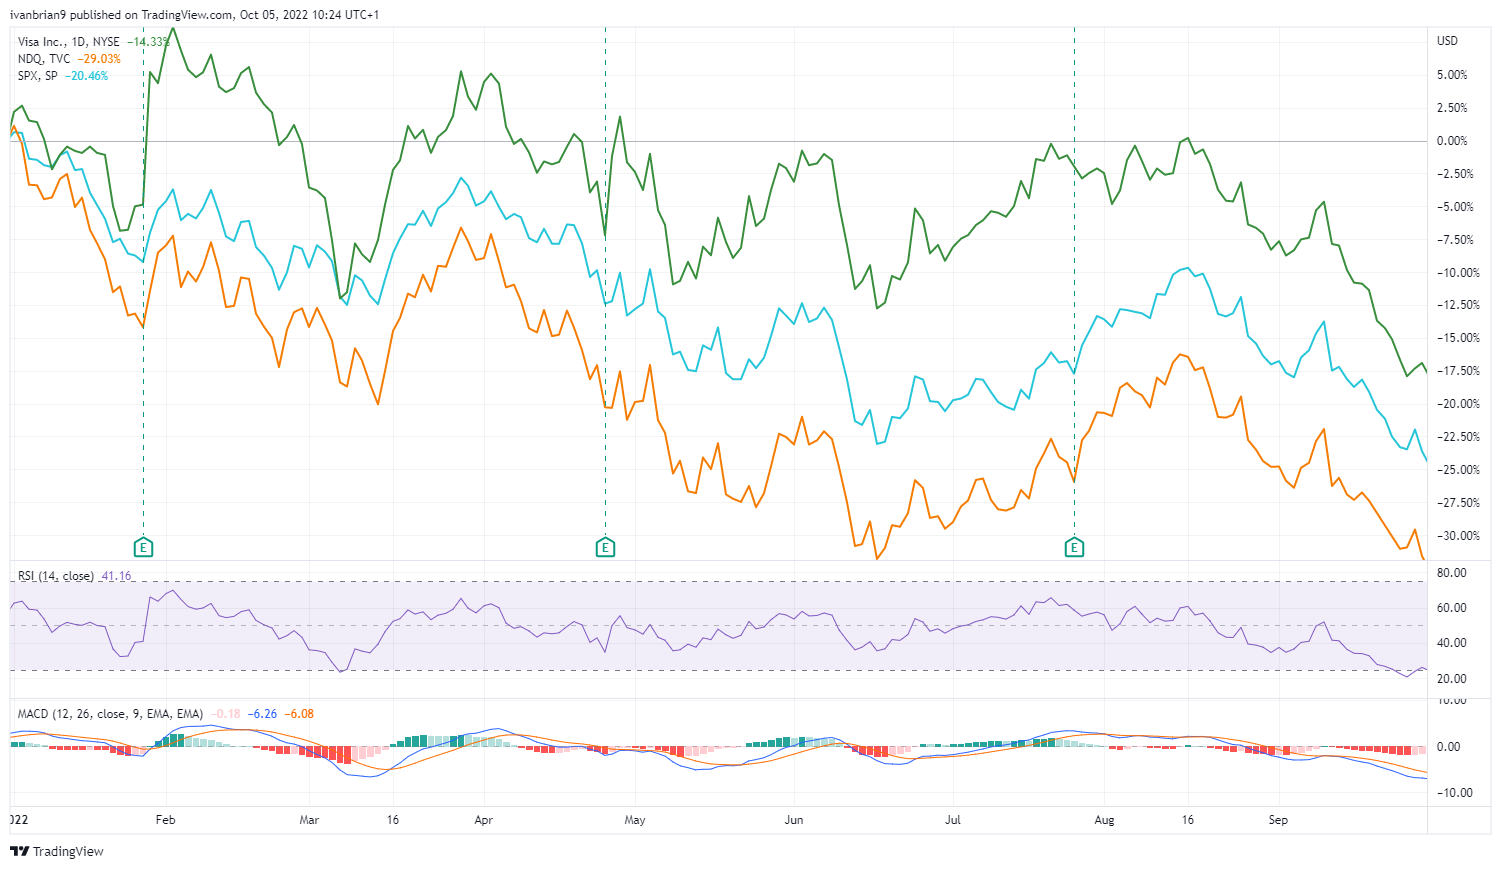
Visa (V) stock has outperformed the main indices by a comfortable margin this year. Mostly because of its strong cash generation giving it defensive qualities in the current storm. The chart below shows year-to-date versus Nasdaq (orange line) and S&P 500 (blue line). Visa is still down on the year but well ahead of the benchmarks.
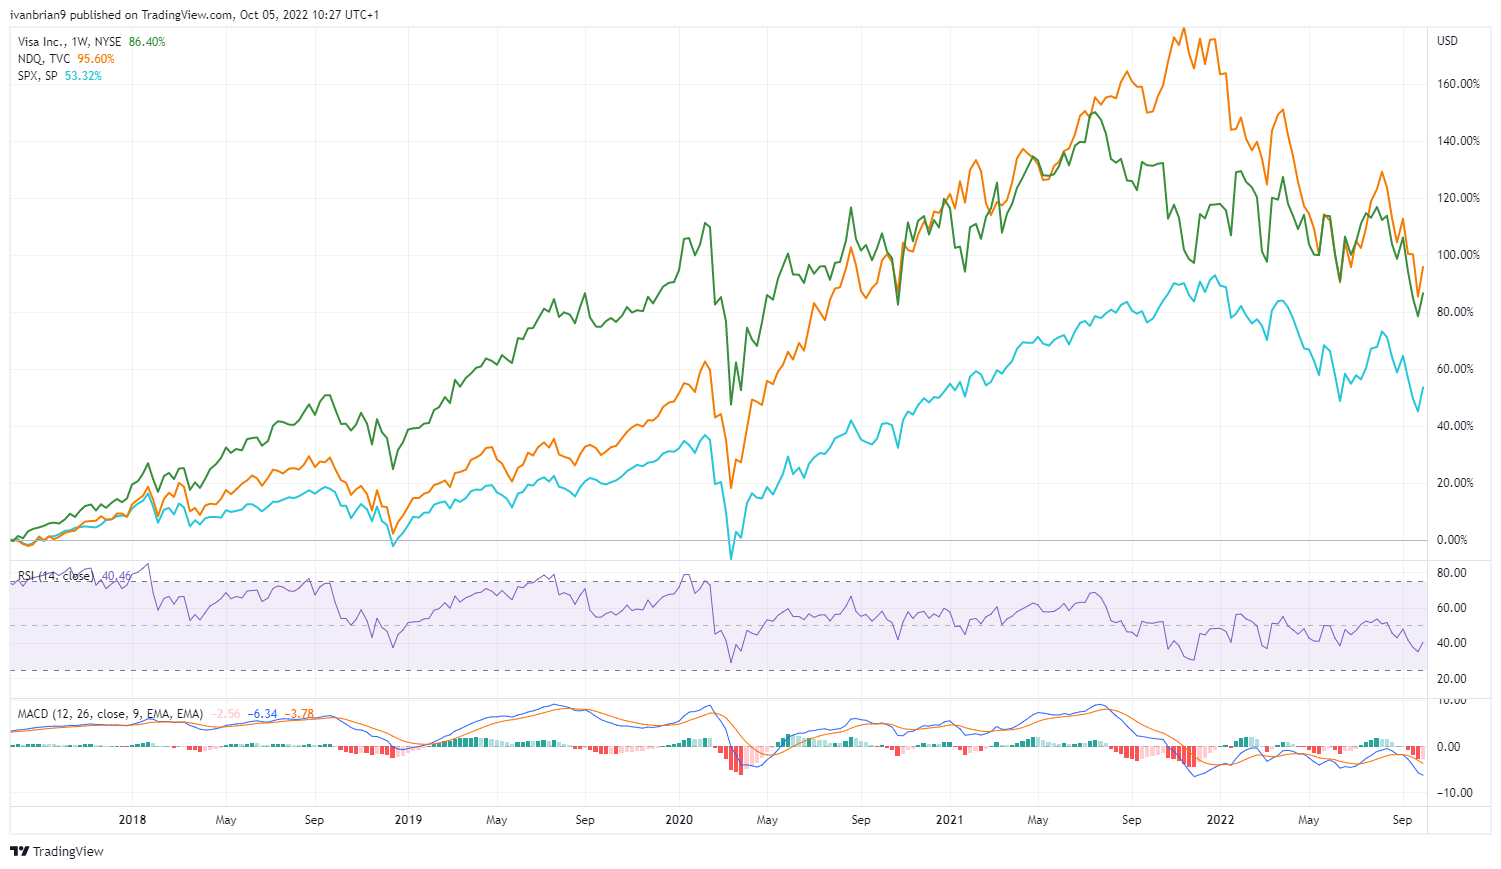
If we go back 5 years to October 2017, Visa still outperforms the S&P 500 and is in a dead heat with the Nasdaq. The Nasdaq has obviously had a huge surge in this period but the recent weakness has taken its cumulative 5-year performance back in line with that of Visa.
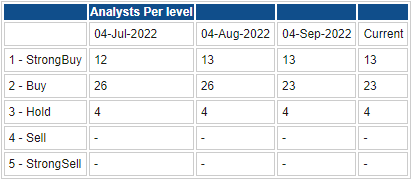
Visa (V) Stock: Wall Street consensus forecasts
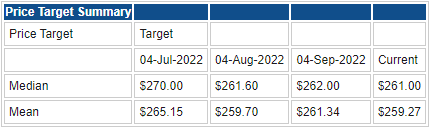
I can write this paragraph without even looking at the Visa stock average price target from Wall Street. It is bullish as they always tend to be. Not a single sell recommendation and a strong average price target of $259. At the time of writing, Visa (V) stock is trading at $185 so that is a whopping 40% above the current price. Let's see what we come up with ourselves now as we dig in further to the valuation.
Source: Refinitiv
Also read: Apple Stock Deep Dive: AAPL price target at $100 on falling 2023 revenues
Key valuation rating metrics
Market cap: $376 billion
Enterprise value: $426 billion
Free float: 1.63 billion
IPO date: 25-Mar-2008
52-week high: $236.96
52-week low: $174.83
Short interest: 1.60%
YTD performance: -16%
5-year performance: 75%
Also read: Walmart Deep Dive Analysis: Hold WMT to play defense vs upcoming US recession
Peer value comparison
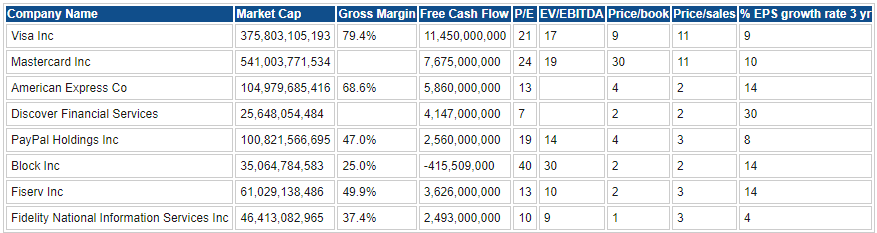
Source: Refinitiv
Macroeconomic backdrop, market cycle , and sector analysis
In our deep dive articles, we differ from the Wall Street community in taking macroeconomic conditions into consideration when formulating our 12-month price targets. This in my view is the biggest weakness of Wall Street forecasts. Macroeconomic conditions will drive micro performance in the long run. Currently, financial conditions may be improving slightly as the market pauses the aggressive selling we have witnessed for most of the year.
The recession – or likely coming recession – is one of the most anticipated recessions in memory. Stock markets have reacted negatively as a result but have priced in some form of recession but most likely a modest one. If indeed the US or world does not enter a recession in 2023, then it would appear stocks may be undervalued in some or many sectors. On the other hand, if the recession is more severe than forecast then we may have lower to go.
Stocks generally tend to bottom before the economy bottoms as financial markets are forward-looking and try to predict the future. The big question on investors' minds is will the Fed and other major central banks pivot and slow or stop the pace of interest rate rises. For the Fed to do this, they have more or less said they want to see a recession. So more interest rate hikes are likely by the end of 2023. Indeed the market is still pricing in another 125 bps of hikes by year-end.
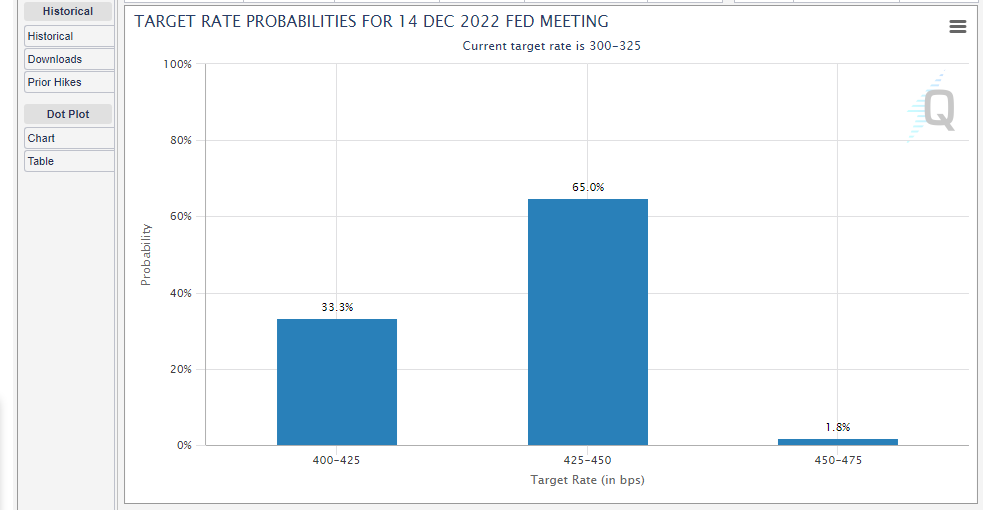
Source: cmegroup.com
However, we can see investors are now betting that rates will stay flat for 2023 with no hikes out to September 2023.
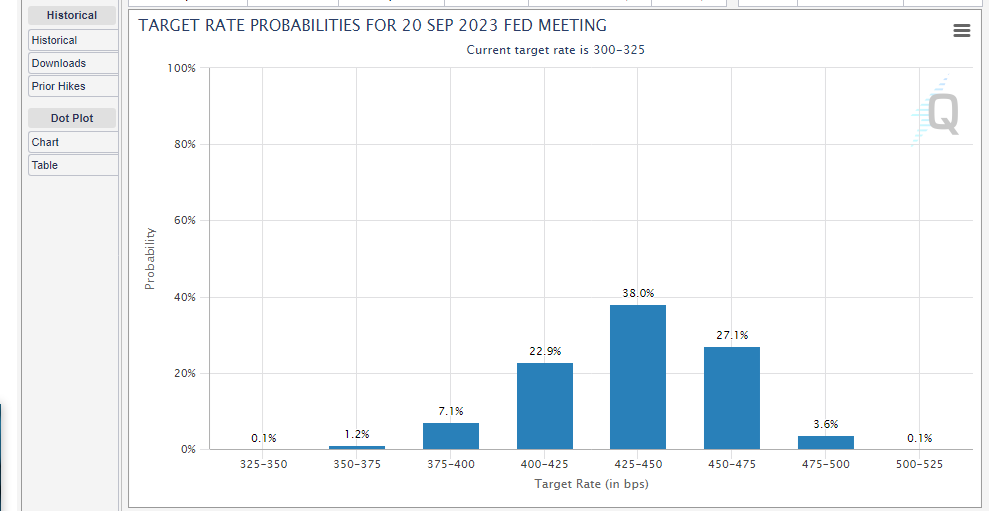
This is a divergence from the Federal Reserve's own recent statements and the so-called dot plot of anticipated future interest rates. This is why stock markets have rallied recently. The reasons were the Bank of England pivoting to bond buying and the Reserve Bank of Australia going for a lower rate hike than anticipated. However, rates going to over 4% may not be enough to curb inflation, especially with oil prices back on the rise as OPEC+ talks about supply cuts.
Overlooking that, though, is the performance of the Nasdaq versus interest rates. The higher rates go the lower for stocks and this rule still holds.
Below is the US 10-year Treasury bond prices versus Nasdaq and S&P 500. The lower the US 10-year goes the higher the yield is (bond prices and yields move inversely. This higher yield as we can see is strongly correlated with lower prices for the S&P 500 and Nasdaq.
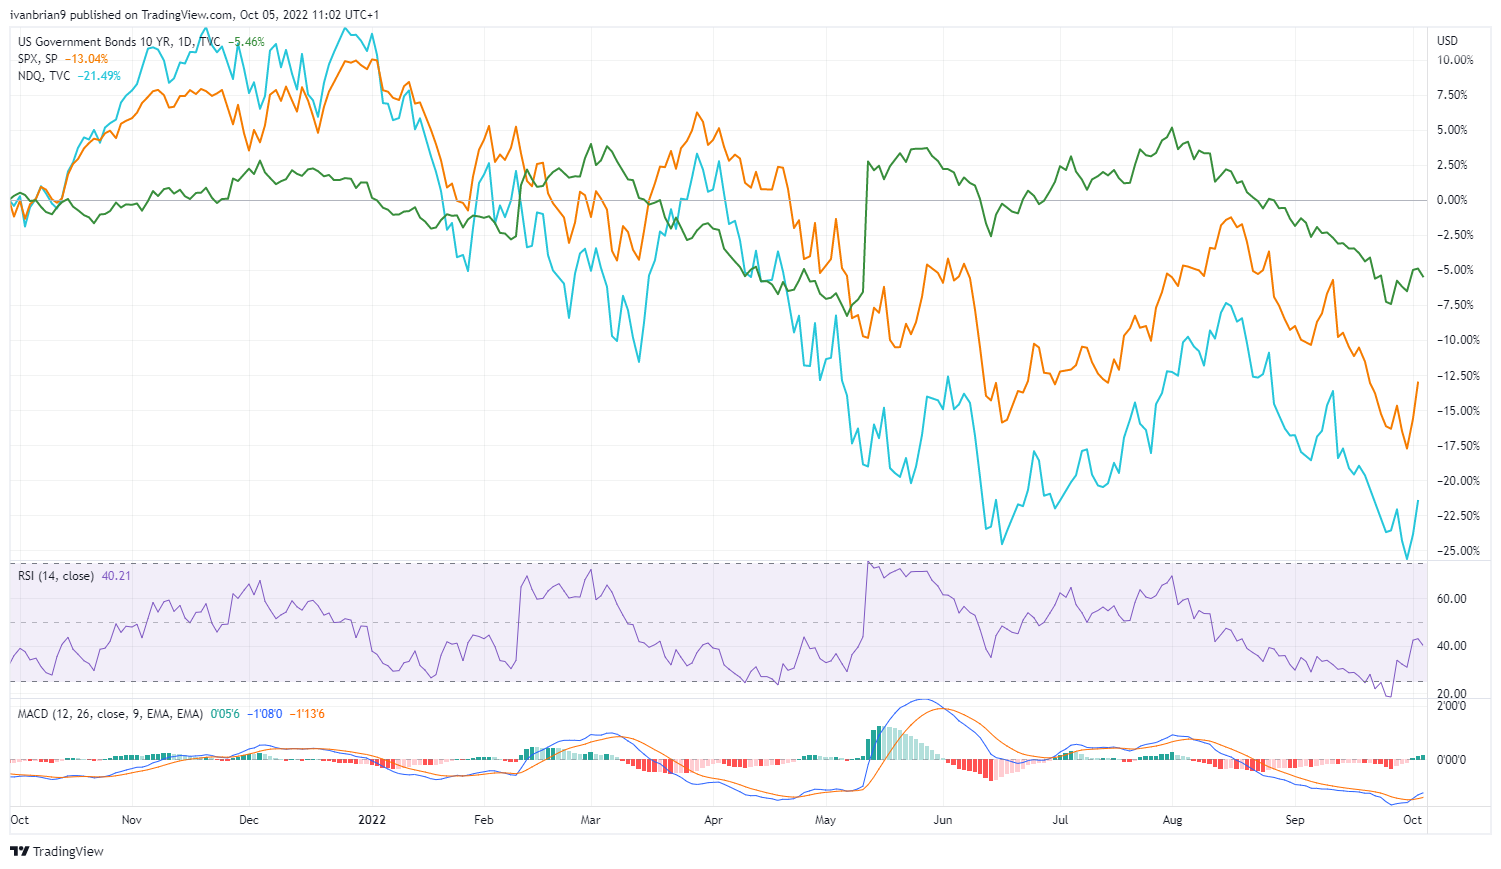
Also of note to those arguing for a pivot, hiking rates to 4% may not be enough.
BofA research says that when inflation goes above 5%, it takes 10 years on average in most countries to get it to drop to 2% again. 2% is the U.S. Fed's stated objective currently. pic.twitter.com/nUUOezGwx2
— Ben Woodward, CFA (@BennettWoodman) September 23, 2022
But let us just take the case of a pivot and try to argue the bull's side for a while. Inflation begins to fall and the Federal Reserve stops when rates get to about 4%. That gives investors an alternative to stocks. The so-called TINA trade is over. It seems pretty clear we will soon enter a recession although by technical standards we are already in one. Two negative quarters of GDP in a row have already been achieved. So where do valuations go in a recession? The answer is lower.
According to Bloomberg, if today were the bear market bottom it would be the highest P/E for the SPX of any bear market low since at least 1957. Average bear market low P/E = 12.6x, current P/E = 17.9x. pic.twitter.com/usn4N7ZR2n
— BWK Capital (@BwkCapital) September 26, 2022
The chart below shows just how low P/E ratios can go in a recession.

So even if the Federal Reserve does pivot it may not be that much good news. The next leg lower is likely to be driven by falling earnings. We have already had a major sell-off from FedEx (FDX) and Nike (NKE) among others. Last quarter it was the retailers with Walmart (WMT). Inventories are an issue, and margins are being squeezed.
Analysts have already marked down earnings for Q3 and that may provide some stability to equity markets in the short term but it does appear we are in for further earnings downgrades in 2023. So as a result when performing our analysis via relative valuation and discounted cash flow we will be lowering our estimates by approximately 10% to take into account the challenging earnings and economic backdrop.
Also read: Amazon Stock Deep Dive: AMZN price target at $106 with near-term risks offset by long-term growth
Recent Visa news and earnings
Visa reported its last earnings on July 26. Continuing with recent trends the company beat on the top and bottom lines. EPS was $1.98 versus a consensus of $1.75 and revenue was $7.28 billion versus a consensus of $7.1 billion. Visa has consistently beaten earnings in the post-pandemic world. On the last earnings call, the company was upbeat citing strong discretionary spending and highlighting the fact that many inflationary spending items do not apply to Visa. The company said it has not seen any pullback in consumers pulling back. Travel spending continued to grow, helping Visa. However, the company did mention the strong US dollar and this strength has accelerated in the current quarter.
"Moving now to our outlook for the fourth quarter. As Al indicated, we're seeing no evidence of a pullback in consumer spending"...we are assuming that the trends we have seen in payments volume and processed transactions will continue through the fourth quarter...With these assumptions, fourth-quarter net revenues could grow at the high teens to 20% range in constant dollars...The dollar has continued to strengthen, significantly increasing the exchange rate drag, which we expect will reduce reported net revenue growth by 4 to 5 points", said Vasant Prabhu, Visa Chief Financial Officer.
Overall, a very strong assessment and setting a high bar for the next quarter's earnings which are on October 26. From the data we see, EPS and revenue estimates have not been revised since the last earnings report, increasing the possibility for a miss or lower guidance next time out in October.
Visa is a top 20 holding in Berkshire Hathaway, Warren Buffet's investment company. Although we should point out he has a larger holding in American Express (AMEX). But the presence of both in his portfolio does provide some reassurance.
Also read: Nvidia Stock Deep Dive Analysis: NVDA price target at $205 with strong revenue growth
Visa forecast and valuation
Here we get into the meat of the article. The valuation goes through DCF and relative valuation. We begin with consensus data from Wall Street taken from Refinitiv and then make our own assumptions based on the macro conditions as outlined above. This will then give us a DCF valuation and a relative valuation. Finally, we use technical analysis to tweak the number into our final 12-month price target for Visa (V) stock.
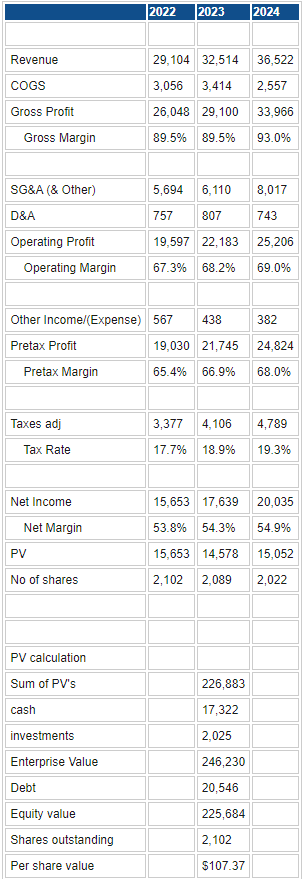
Source: Refinitiv and FXStreet calculations
In the calculation above we have taken consensus forecasts from Refinitiv and applied an average EV/EBITDA exit multiple and or Price/sales and net margin multiples. This gives us a DCF of $107.37.
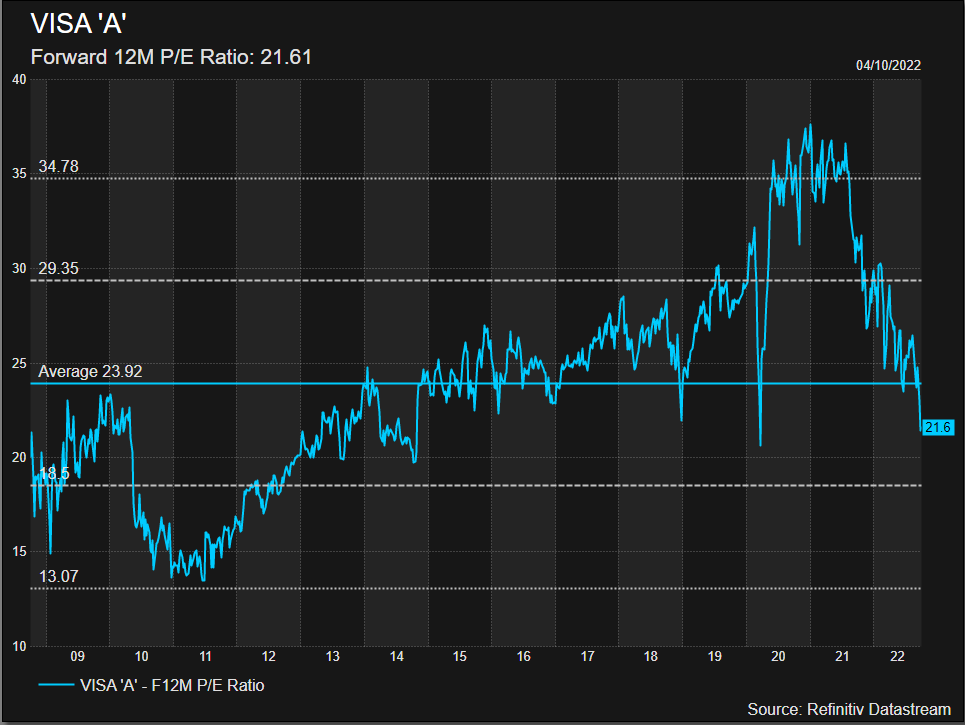
Taking a relative valuation the first series of columns outlines the consensus forecasts. Applying the standard P/E of 25 gives a range of price targets. It should be noted that 24 is the average P/E ratio going back to 2009 as the Data Stream chart below our table shows. It does go lower in times of recession so we have used a P/E of 20 to show what we feel could and perhaps should happen in a recession. But that was the Global Financial Crisis, a severe depression, not a regular or even deep recession but something far more severe.
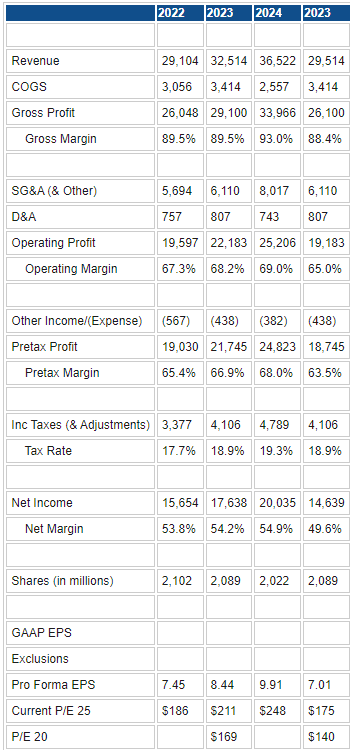
Source: Refinitiv and FXStreet calculations
Adjusting the 2023 figures (this is a 12-month price target after all) lower by 10% is we feel appropriate given the macro backdrop spoken about above. This then gives price targets of $175 or $140 using a lower 20 P/E ratio. Mastercard trades on a higher multiple but American Express trades lower. Visa's current margins though justify this versus American Express.
Visa Technical analysis
We cannot hide from the fact that Visa (V) stock has exhibited some notably bearish features on the chart lately. First, and perhaps most important, is the break of the 200-week moving average. Support therefore at the trendline becomes key at $162. The pandemic low near $133.93 looks technically like it may be tested but this level should hold given the macro backdrop is not as negative as then and Visa also has a stronger outlook than it did during those uncertain times.
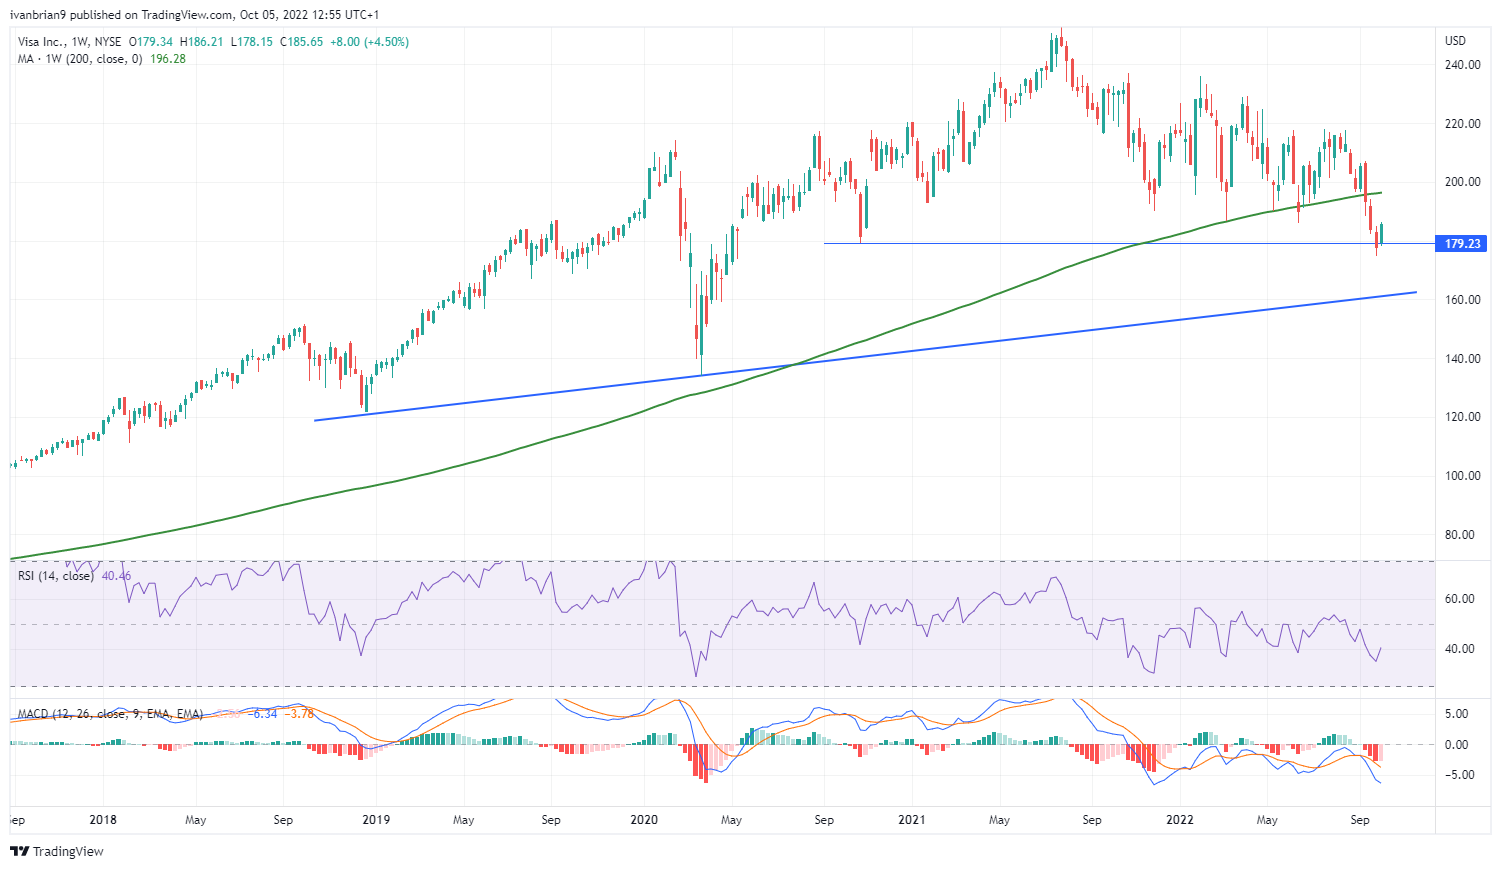
Visa (V) stock chart, weekly
Visa: Executive summary, recommendation and price target
Based on the above we run with a 12-month price target of $175. Given the current market price is currently $185 this necessitates a HOLD rating. Current earnings may provide a negative outlook in our view as the bar has been set high by the company and analyst expectations. That could see some short-term price risks but in the longer term, we believe the strong and cash-generative nature of Visa's model should see it recover.
There is some evidence that credit card usage increases during recessions. That would be positive but in a deep recession, bad debts increase offsetting this. So Visa may actually see increased usage and if bad debt provisions are appropriate this may be another potential counter-cyclical tailwind. Visa remains in a relatively strong cash position and stable. The P/E valuation may already show that a recession is priced in. A P/E of 24 is the long-term average and Visa (V) already trades on such a multiple.
Upside risks
- The United States does not enter a recession.
- Federal Reserve stops raising interest rates.
- P/E already pricing in a recession?
Downside risks
- Deep recession sees bad debt losses under provided for.
- P/E falls below 20 in a deep recession.
- Consumer spending falls more than anticipated in a deep recession.
Premium
You have reached your limit of 3 free articles for this month.
Start your subscription and get access to all our original articles.
Author

Ivan Brian
FXStreet
Ivan Brian started his career with AIB Bank in corporate finance and then worked for seven years at Baxter. He started as a macro analyst before becoming Head of Research and then CFO.


