Amazon Stock Deep Dive: AMZN price target at $106 with near-term risks offset by long-term growth

In this deep-dive analysis of Amazon (AMZN) stock, we utilize both DCF (discounted cash flow) and comparative P/E valuation models to arrive at our average twelve-month price target. We run through different scenarios based largely on margin assumptions with some historical analysis of where average industry-wide and index valuation ratios settle during periods of bear markets and recessions now that both the S&P 500 and Nasdaq have officially entered bear market territory. We then combine this with a technical analysis of Amazon to further strengthen our price target case.
Contents
- Company overview and history
- Wall Street consensus forecasts
- Key valuation rating metrics
- Peer value comparison
- Macroeconomic backdrop, market cycle, and sector analysis
- Recent news and earnings
- Forecast and valuation
- Technical analysis
- Executive summary, recommendation, and price target
Amazon: Company overview and history
Amazon was founded by Jeff Bezos in 1994. Amazon was listed via IPO in May 1997 and trades on the Nasdaq under the ticker AMZN. The company turned its first profit in the second half of 2001. The company has since gone on to be one of the most valuable companies in history with a market cap of over $1 trillion currently. It joined the elusive trillion-dollar club with fellow tech titans Apple (AAPL), Microsoft (MSFT) and Google (GOOGL).
Amazon is engaged in the sale of consumer products and services to the retail market via a series of domestic and international websites and online stores. The company operates through three distinct segments.
North America is the original retail business that expanded from an online bookseller to a consumer conglomerate offering a huge lineup of diverse products. The international division is a copy of the North American business model but with local websites in large consumer regions such as the UK, France, Japan, etc.
Finally, Amazon also operates the growing AWS (Amazon Web Services) division, which offers cloud services to retail and corporate customers. Amazon also competes with Netflix (NFLX) through its Amazon Prime streaming service, which is part of its subscription business. This segment operates and is accounted for in both North American and International segments.
Also read: Apple Stock Deep Dive: AAPL price target at $100 on falling 2023 revenues
As we can see below, North America still represents the most important geographical driver of Amazon's profit, contributing 60% for the full year 2021. This, however, has been stable with AWS representing the main growth business.
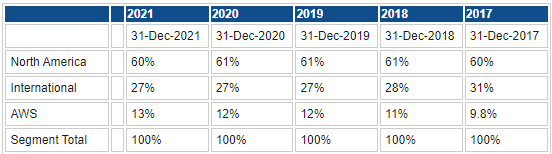
Source: Refinitiv and FXStreet calculations
Ecommerce is the main driver of sales at Amazon with nearly 50% of revenues coming from this segment.
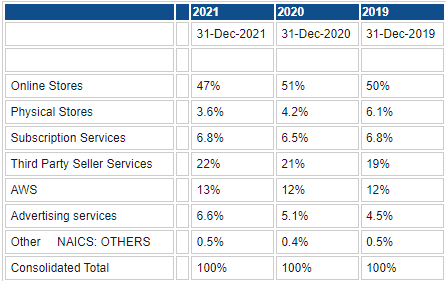
Source: Refinitiv and FXStreet calculations
The pandemic proved to be a boon for Amazon with a global, locked-in, and captive customer base. This resulted in huge gains in both revenues and profits and a resultant share price appreciation of nearly 100% from the pandemic lows in March 2020 until the end of December 2021. Despite this, Amazon actually underperformed both the S&P 500 and the Nasdaq indices as shown below.
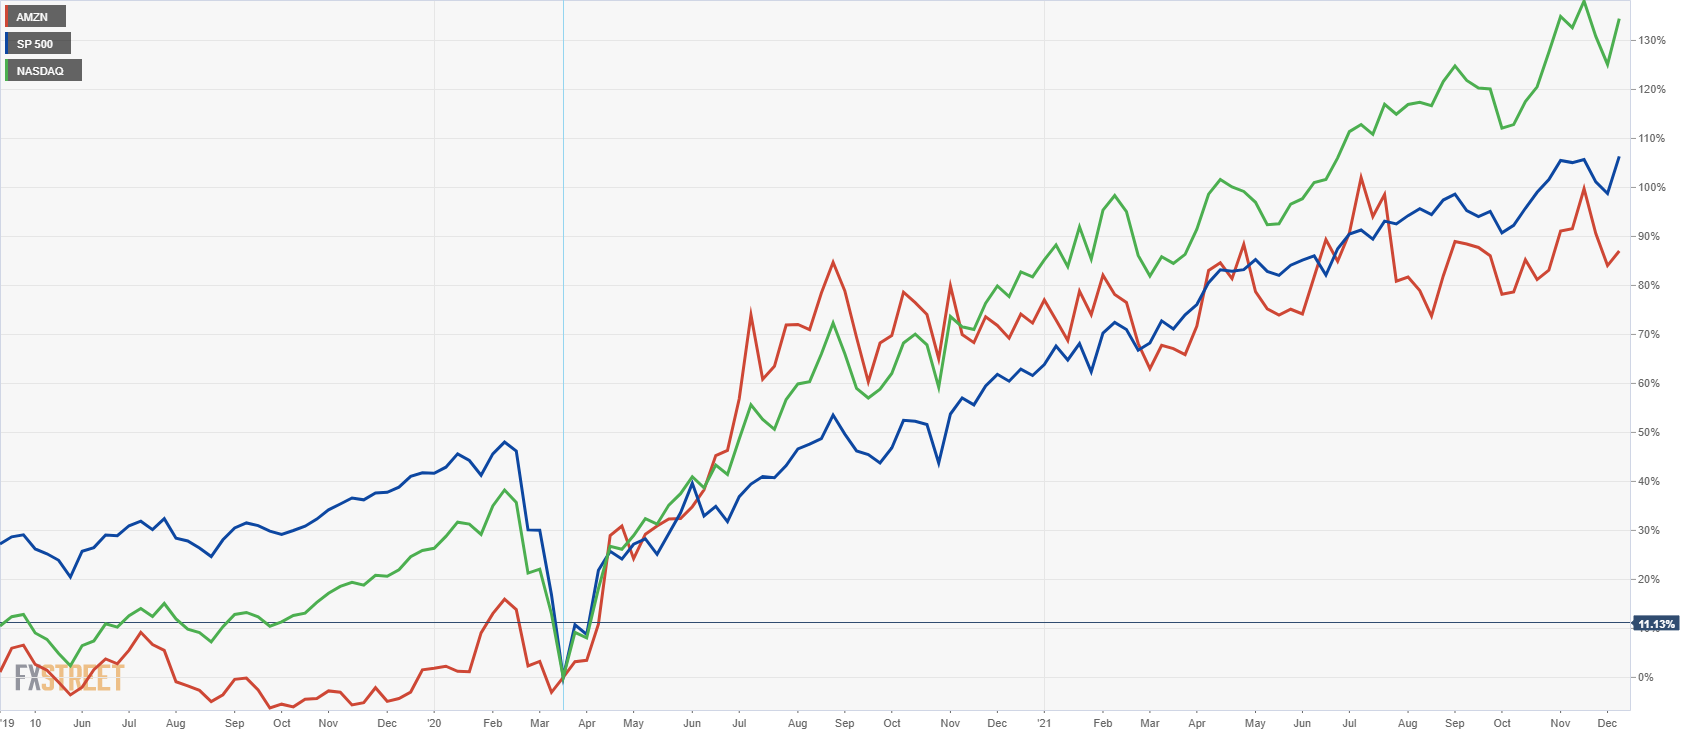
Amazon (red) versus S&P 500 (blue) and Nasdaq (green) from March 2020 to December 2021 (Percentage gain)
Things have since taken a decidedly worse turn in 2022. Consumers, released into the open, have flocked to physical stores and largely reduced their online activity. Coupled with this has been the deteriorating macroeconomic and geopolitical environment, supply chain issues, and central bank tightening. This meant a number of headwinds for 2022. This culminated in Amazon (AMZN) losing 40% of its value year to date in 2022, again underperforming both the Nasdaq and S&P 500.
-637908801391077244.png)
Amazon (red) versus S&P 500 (blue) and Nasdaq (green) Year to date 2022 percentage change
Amazon: Wall Street consensus forecasts
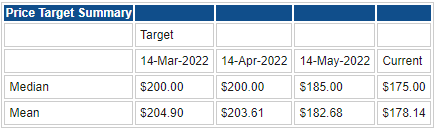
Source: Refinitiv and FXStreet calculations
Wall Street remains upbeat on prospects for Amazon. While the average price target has fallen by $25 since March, the average of $175 remains a colossal 75% above the current closing price. This is too optimistic in our view.
Amazon: Key valuation rating metrics
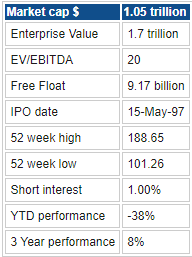
Source: Refinitiv, TradingView and FXStreet calculations
Amazon: Peer value comparison
Despite recent share price falls, Amazon still trades on a relatively high valuation compared to sector peers. The P/E at 50 is notably high and is a risk to the future valuation of the stock. While the forward P/E is trading slightly lower at 45, this is not historically high in our estimation but is based on EPS forecasts for the next 12 months that may already be too high.
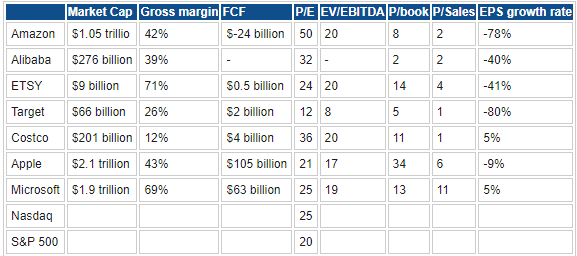
Source: Refinitiv, TradingView and FXStreet calculations
Amazon: Macroeconomic backdrop, market cycle and sector analysis
There can be no argument now that the macroeconomic backdrop has changed utterly in the past six months. In addition, the landscape seems to be constantly evolving and is perhaps one of the greater periods of macroeconomic uncertainty in the past 20 years. We have witnessed the Federal Reserve shift from quantitative easing to tightening and raising rates aggressively. This has led to both bond and equity markets falling sharply. In fact, 2022 is on course to be the worst bond market return in history. Equities are now in bear market territory for all major indices. We write in advance of June's Fed policy decision where the consensus has already shifted to a shock-and-awe rate hike of 75 basis points. The reason of course is runaway inflation.
Regular readers of our deep dives will know we have outlined that the average bear market lasts one year and sees a decline of approximately 40% for the main equity index – the S&P 500. Without a recession though, that average decline moves closer to 30%. Recently, we have done some further analysis to reinforce the probability that we may be closer to the bottom. Excluding 2000's DotCom bear market and the 2008 financial crisis sees the average bear market running at about a 30% decline, irrespective of whether or not the US economy goes into recession.
We do expect a 2023 US recession, but we do not expect it to match the 2008 recession nor the one that attended the DotCom crash. 30% seems about right, but financial markets can and do overextend in both directions. With the Nasdaq being considerably higher beta than the S&P 500, which all this research is based on, we will see more losses for the Nasdaq and its constituents.
Also read: Nvidia Stock Deep Dive Analysis: NVDA price target at $205 with strong revenue growth
As we can see in the chart below, earnings per share (EPS) estimates are still way too high. Wall Street is penciling in EPS growth of 5% for the next quarter and a more modest decline of 2% ex-energy. This still looks too high. The recent decline in the S&P 500 has taken it back toward its long-term price/earnings (P/E) average. However, if earnings begin to come down, that will necessitate more declines for the index.
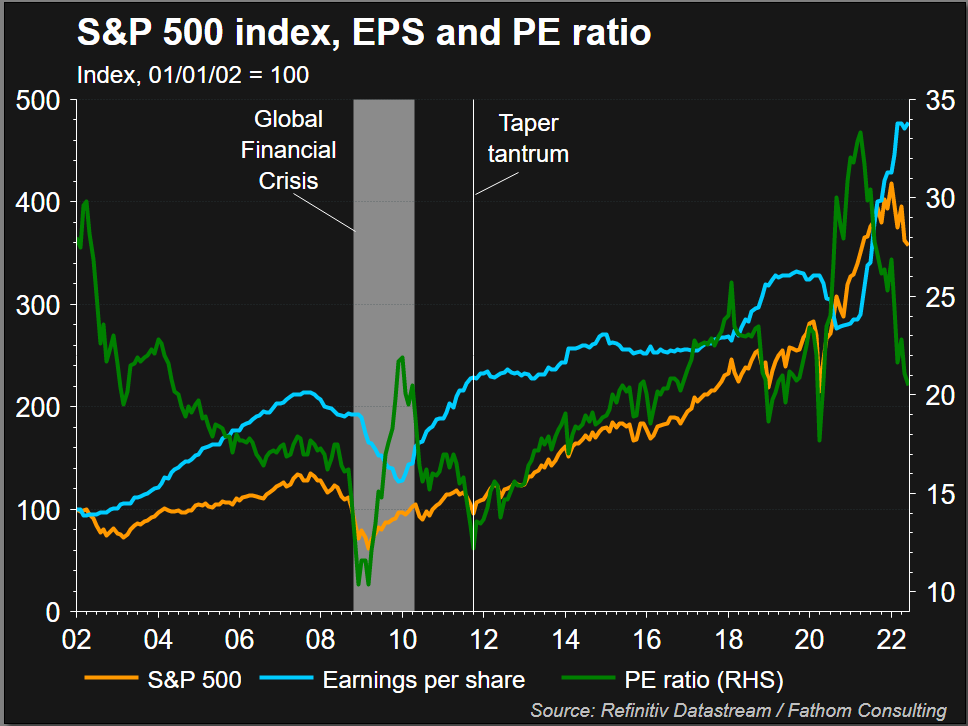
Readers can see on the chart below that the EPS estimates have flatlined but not declined. This could be the next headwind for equities.
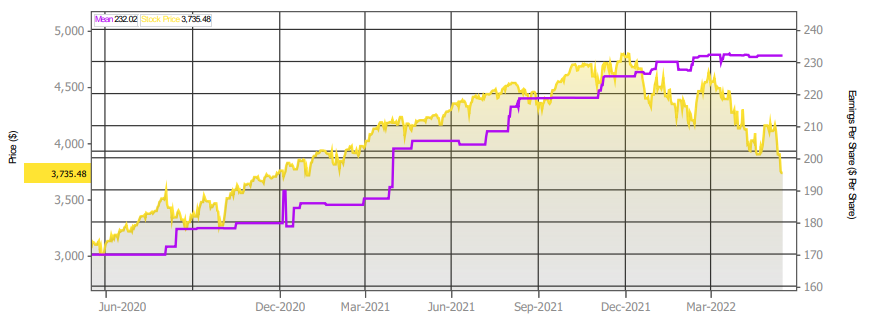
S&P 500 index (yellow) versus average EPS estimates (purple), source: Refinitiv.
Retail sector
The US consumer has already begun to adapt their behavior in response to rising inflation. Consumer sentiment is extremely low. In fact, the widely watched University of Michigan consumer sentiment survey shows a multi-decade low. Recent reports from discount retailers Costco (COST) and Walmart (WMT) highlighted consumer behavior shifting to lower margin, lower-cost items and away from big-ticket discretionary spending. This trend will accelerate and continue in the coming quarters. There is always a lag between reported inflation and the real behavioral changes enacted by consumers.
Amazon: Recent news and earnings
Amazon reported its most recent earnings for the first quarter of 2022 on April 28. EPS missed considerably at $-0.38 versus the consensus of $0.42. Revenues were more or less in line at $116.44 billion. Costs increased by nearly $6 billion in Q1, which was the main factor in the unexpected loss. Amazon forecasts this to reduce to $4 billion for Q2. However, we remain decidedly uncomfortable with this assumption given the continued surge in input, energy and shipping costs, as well as supply chain issues. We expect margins to reduce or flatline at best.
The first quarter saw online sales fall 1% versus a year earlier as consumers opted for physical retailers versus the internet. This trend looks to have continued and even accelerated during Q2. Amazon Web Services was the sectoral star, but this still remains a small but growing part of overall revenues and profitability. Amazon included a loss of $7.6 billion from its investment in EV startup Rivian (RIVN). Rivian stock closed out the quarter at $50.24 and is currently trading nearly 50% lower at $27.30. Assuming standard mark-to-market risk, this is yet another headwind going forward. The $7.6 billion loss from the investment in Rivian for the first quarter was the result of a near 50% decline in Rivian's share price. This looks then to be a similar outcome for Q2.
Amazon gave revenue guidance for the second quarter at $116 billion to $121 billion, while it forecast a loss/profit range of $-1 billion to $3 billion. Amazon forecasts 200 basis points of margin erosion from the strong dollar.
Also read: Tesla Stock Deep Dive: Price target at $400 on China headwinds, margin compression, lower deliveries
Amazon: Forecast and valuation
Using a traditional DCF model with forecasted inputs for free cash flow, net debt, capex and revenue give us a DCF price target of $106 for Amazon. This is more or less in line with the current price of $102.31, so the efficient market theory appears to be working here!
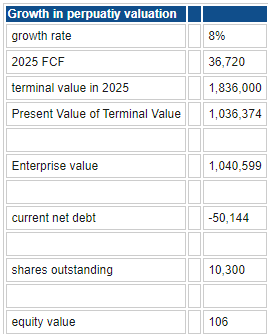
Source: Refinitiv and FXStreet calculations
However, we are less than confident in the consensus, and in the table below we have outlined the EPS based on margins remaining constant and a worst-case scenario. Even if margins remain the same and revenue forecasts prove accurate, that implies a 12-month EPS of $1.64. Amazon is currently trading on 50 times earnings, so $1.64 X 50 gives us a target of $82. Gross margins and EBITDA margins have been flatlining or declining as the two charts below illustrate. Forecasting then gross margins to remain flat looks conservative given what is happening to energy and the dollar.
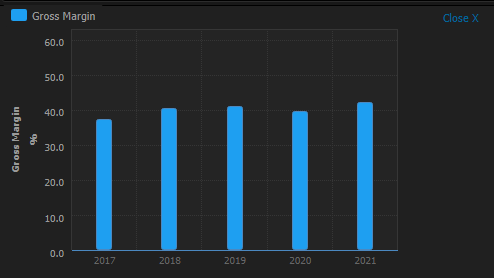
Source: Refinitiv
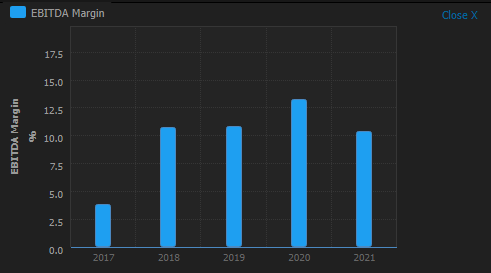
Source: Refinitiv
We do feel there is more near-term risk of declines with the next quarter's earnings. As outlined above, the Rivian stake should provide further losses, and the strong US dollar and supply chain issues will continue to put pressure on margins. However, we do feel the continued growth of AWS will serve to partially offset these concerns but only over a longer time horizon. Based on this, we would likely be more inclined to revise upward the consensus revenue projections from 2023 onwards.
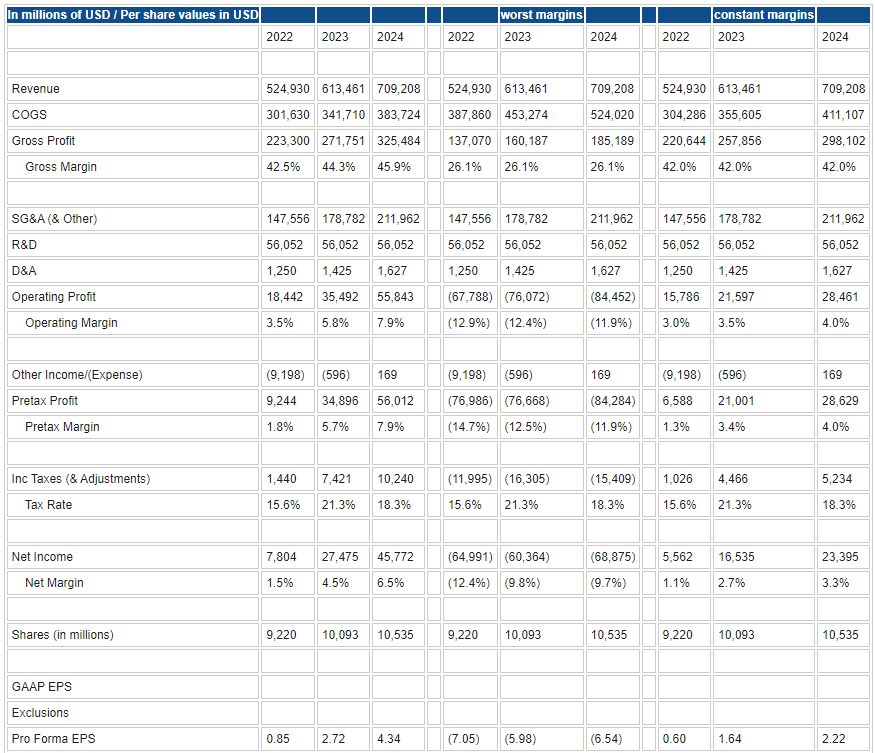
Source: Refinitiv and FXStreet calculations
Just to reiterate, Amazon is currently trading at 50 times earnings, so EPS of $1.64 X 50 gives us a target of $82. Our risks are to a rerating of Amazon's high P/E multiple. A rerating to 40 would mean a price target of $66. Amazon's average P/E ratio for the past five years is over 100, so the current level is actually close to the bottom of the range.
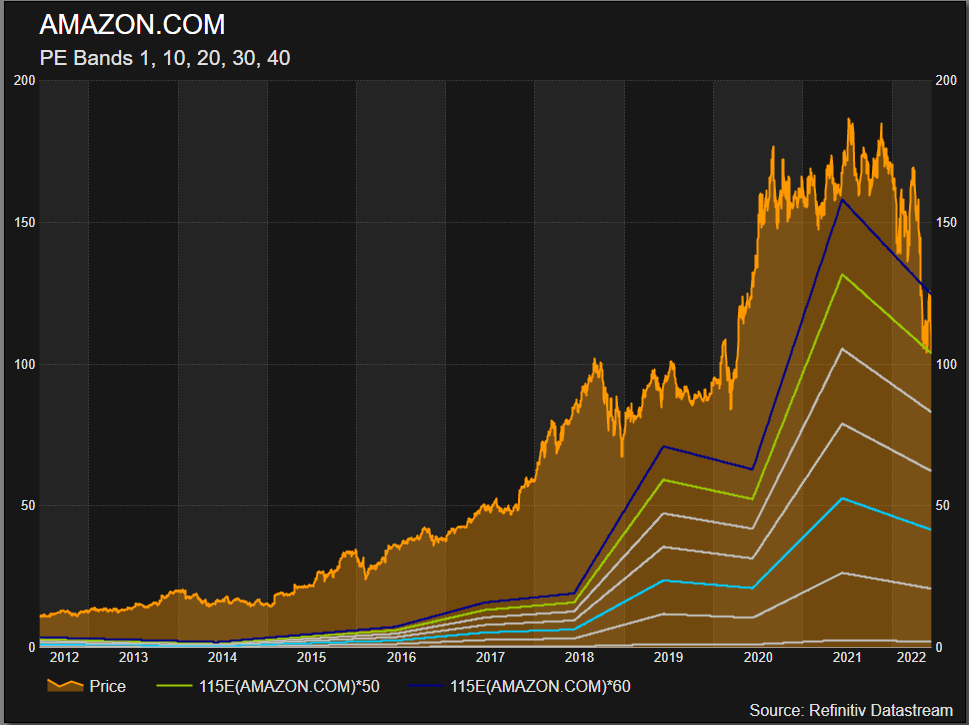
Based on all the above, we find an average target of $90 is acceptable – the average of our DCF model and EPS estimates using constant margins.
Amazon: Technical analysis
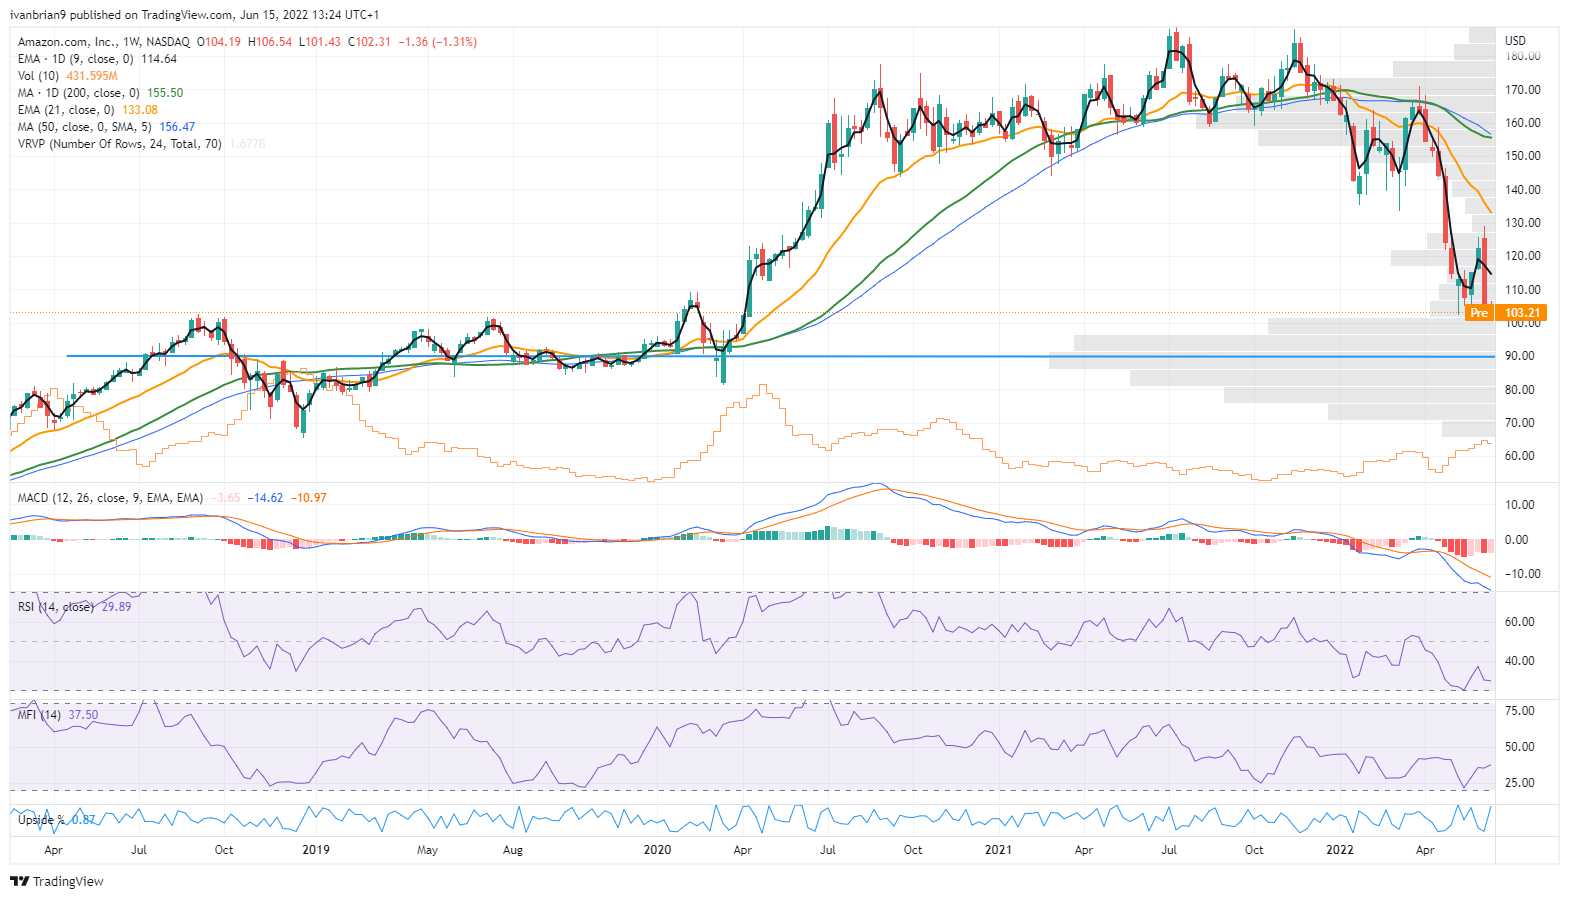
For ease of comparison, we have placed a horizontal line at $90 in the AMZN stock chart below. Volume is significant at the price level, indicating price acceptance and stability. Therefore it is a point of fair value and strong support. It also represents a near-total retracement back to the March 2020 pandemic lows at $81.
Amazon: Executive summary, recommendation and price target
The technical picture above leans us more toward viewing $90 as a support rather than a price target. We do think near-term risks are likely for Amazon. We have already highlighted concerns over the continued mark-to-market losses from Rivian, margins remaining flat, and the overall bearish environment. This means we believe Amazon stock will target $90 but sooner rather than the more normal 12-month price target time horizon.
Q2 earnings results, which will be released on July 28, could be the catalyst for a washout toward $90 or even slightly below. That is likely to be the bottom of the cycle in our view. Margins will remain flat, but at that stage, we should be near the worst-case scenario for Rivian, and AWS should begin to accelerate its overall bottom-line contribution.
On a macro level, 2024 should see inflation and interest rates at lower levels, while Amazon will continue to benefit from cost synergies that no physical retailer can match. This makes Amazon attractive from an inflationary perspective. Margins should pick up strongly in 2024 as should revenue growth due to structural changes in the continued adoption of online versus physical retailers. This is especially evident in the younger demographic. Given that markets are forward-looking, we believe Amazon is nearer to the bottom of the cycle and that the next earnings quarter could be the washout required. From 2023 onward, we could see EPS upgrades that fuel the longer-term bullish case.
Based on the above, we opt for our initial DCF valuation of a 12-month price target of $106 and offer a HOLD rating.
Upside risks to our valuation
- US avoids 2023 recession.
- Inflation comes down more quickly than currently priced.
- Inflation coming down more quickly leads to rate hike expectations lowering.
- AWS growth accelerates.
- Margin growth continues.
Downside risks to our valuation
- Equities move toward bottom of P/E valuation ranges for the S&P 500.
- Rivian continues to fall sharply.
- Higher costs leade margins to continue to suffer.
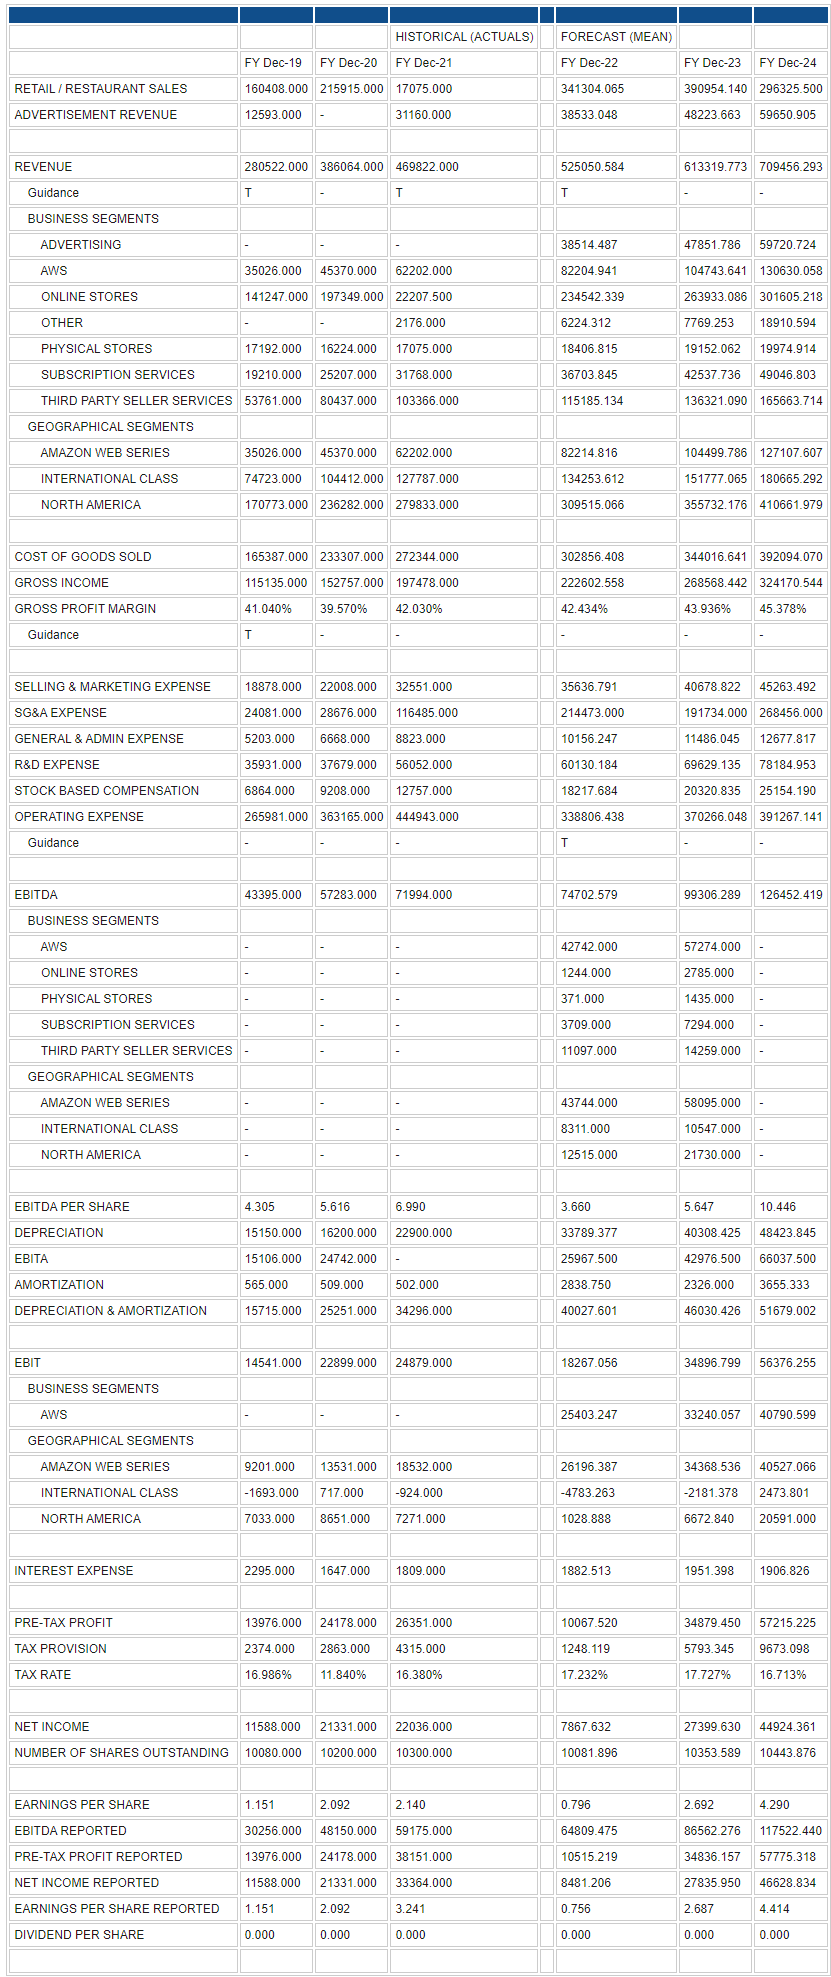
Amazon reported earnings and forecast tables below. These are the foundation for all our DCF models. Data from Refinitiv.
Author

Ivan Brian
FXStreet
Ivan Brian started his career with AIB Bank in corporate finance and then worked for seven years at Baxter. He started as a macro analyst before becoming Head of Research and then CFO.


