USDCAD attempting to regain 1.3500 after hitting six-week lows at 1.3470
- The US dollar plunges 2.5% on Friday to hit six-week lows at 1.3470.
- A mixed NFP report sends the greenback tumbling.
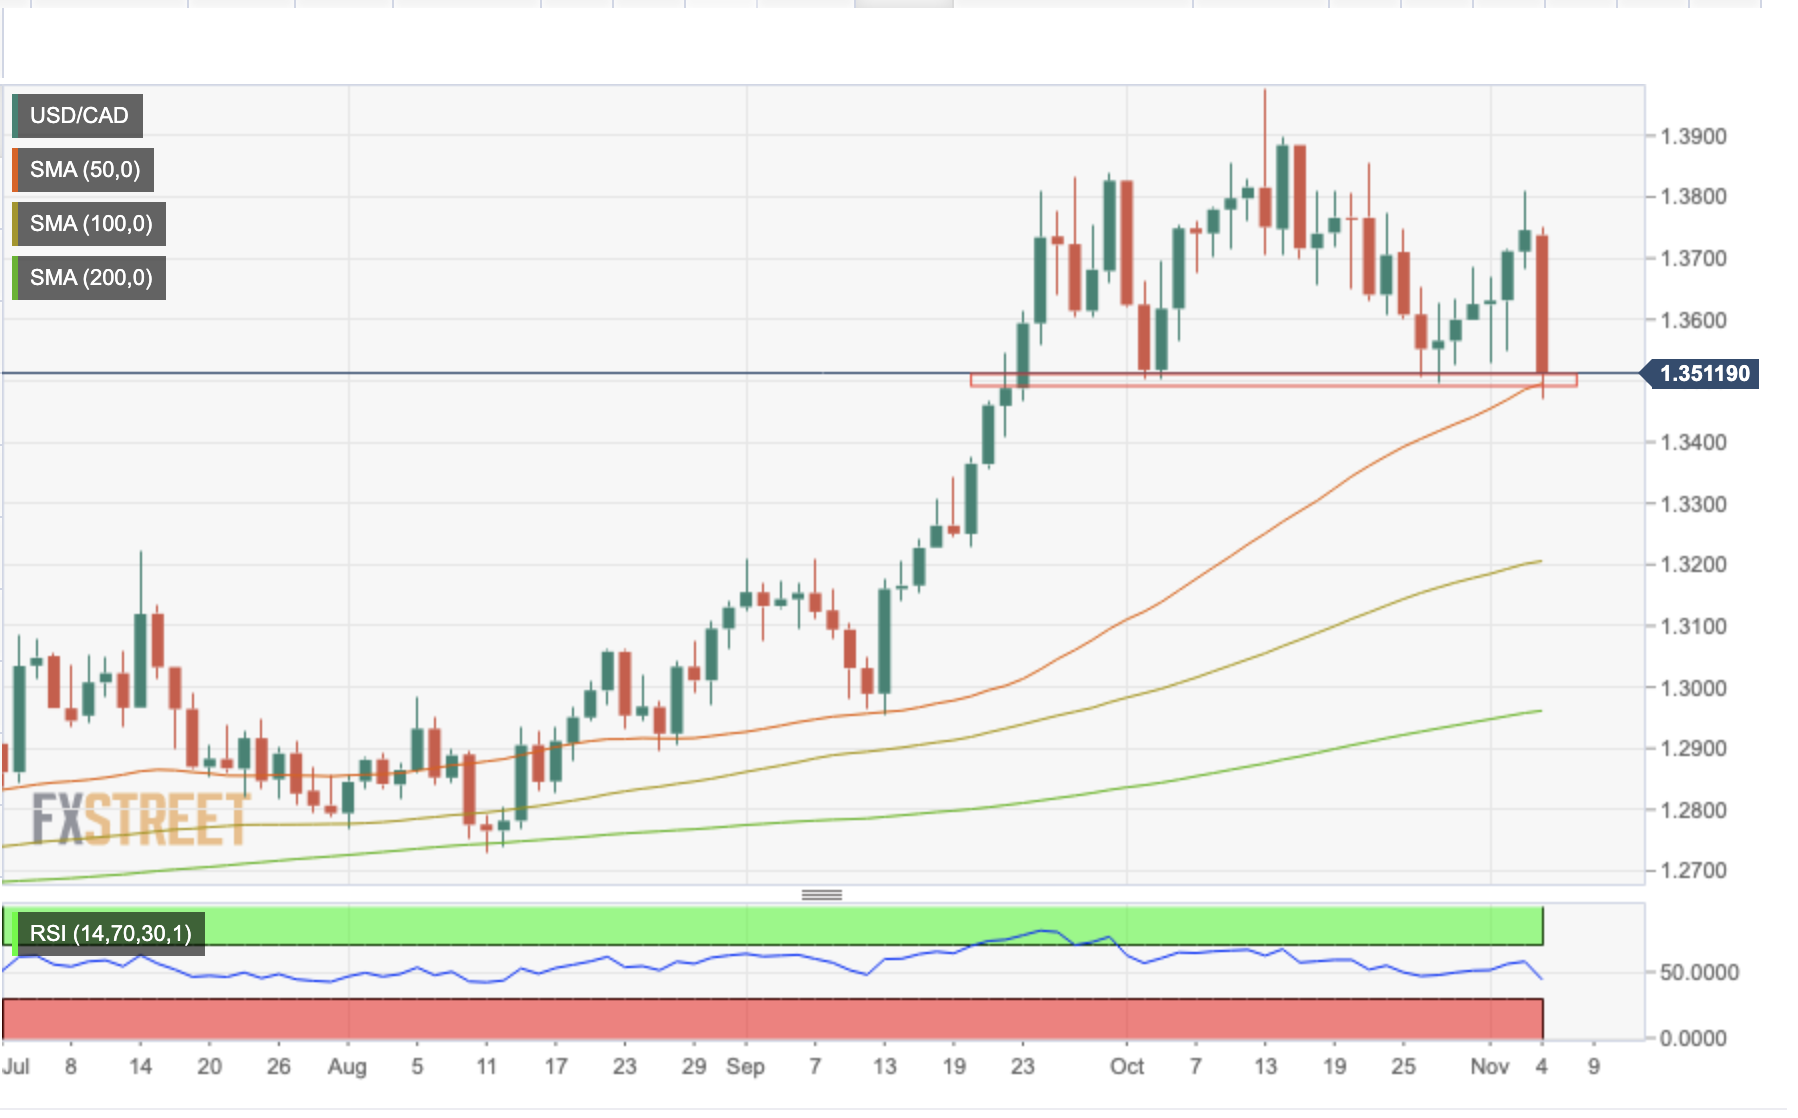
- USDCAD is testing the neckline of a potential H&S formation.

The US dollar is about to close its worst daily performance in some months with a nearly 1.8% sell-off. The pair has extended its reversal from Thursday’s high at 1.3800 to levels below 1.3500 for the first time since late September.
A mixed employment report has hammered the US dollar
The US Non-Farm Payrolls report has shown a 261K increase in October, beating expectations of 200K, and September’s figures have been revised up to 315K, from the previously estimated 4 K.
The unemployment rate, however, has risen to 3.7% from 3.5% in September, above the consensus 3.6%, while hourly earnings increased 4,7% in October from 5% in September. These figures suggest that labor market conditions might be easing, which has tamed expectations of further aggressive rate hikes by the Fed.
The US dollar, which had been surging since Wednesday, after US Fed President, Jeremy Powell, reiterated the need for further monetary tightening, dropped like a stone on Friday on the first signs that the bank’s monetary policy could be starting to take effect.
USDCAD is testing support at 1.3500
The daily chart shows the pair reaching the area where the neckline of a Head And Shoulders formation meets the 50-day SMA, at 1.3500.
A clear breach of that area would activate the H&S pattern, and could push the pair towards 1.3200 (September 1 and 7 highs and the100-day SMA) and then probably the 1.3000 psychological level.
USDCAD daily chart
Technical levels to watch
Author

Guillermo Alcala
FXStreet
Graduated in Communication Sciences at the Universidad del Pais Vasco and Universiteit van Amsterdam, Guillermo has been working as financial news editor and copywriter in diverse Forex-related firms, like FXStreet and Kantox.