|

USD/ZAR Price Analysis: Below 100-day SMA inside short-term falling wedge

  • USD/ZAR remains on the back foot near three-month low.
  • Sustained trading below key SMA keeps the sellers hopeful.
  • Bullish chart formation, oversold RSI conditions suggest intermediate pullback in prices.

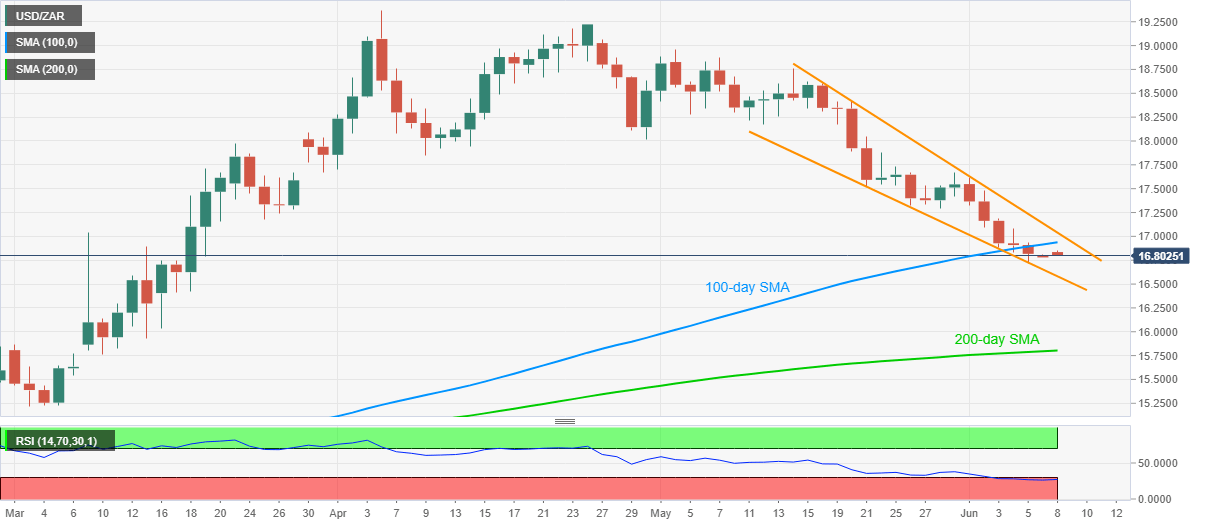
While failing to extend the day-start pullback to 16.85, USD/ZAR drops to 16.80 amid the initial Asian session on Monday. As a result, the quote seesaws around the lowest since March 18 by the press time.

The pair portrays a bullish technical pattern on the daily chart amid oversold RSI conditions. However, a sustained trading below 100-day SMA favors the sellers.

Against this backdrop, the bears may aim for a descending trend line from May 21, currently around 16.58, as immediate support during the further downside.

Though, oversold RSI conditions might restrict the pair’s additional declines, if not then 16.00 and 200-day SMA level of 15.80 could lure the bears.

On the upside, a 100-day SMA level of 16.94 may offer immediate resistance to the pair ahead of the bullish formation’s upper line, at 17.05 now.

Should there be a clear break above 17.05, the bullish pattern gets confirmed, which in turn could the theoretical run-up towards 19.00. However, May 29 high of 17.67 and April 30 low of 18.00 could offer intermediate halts during the rise.

USD/ZAR daily chart

Trend: Pullback expected

Additional important levels

Overview
Today last price16.7745
Today Daily Change-0.0423
Today Daily Change %-0.25%
Today daily open16.8168
 
Trends
Daily SMA2017.744
Daily SMA5018.2252
Daily SMA10016.8927
Daily SMA20015.7882
 
Levels
Previous Daily High16.9388
Previous Daily Low16.7164
Previous Weekly High17.6219
Previous Weekly Low16.7164
Previous Monthly High18.9592
Previous Monthly Low17.2921
Daily Fibonacci 38.2%16.8013
Daily Fibonacci 61.8%16.8538
Daily Pivot Point S116.7092
Daily Pivot Point S216.6016
Daily Pivot Point S316.4868
Daily Pivot Point R116.9316
Daily Pivot Point R217.0464
Daily Pivot Point R317.154

Author

Anil Panchal

Anil Panchal

FXStreet

Anil Panchal has nearly 15 years of experience in tracking financial markets. With a keen interest in macroeconomics, Anil aptly tracks global news/updates and stays well-informed about the global financial moves and their implications.

More from Anil Panchal
Share:

Editor's Picks

EUR/USD tests nine-day EMA support near 1.1850

EUR/USD inches lower during the Asian hours on Monday, trading around 1.1870 at the time of writing. The 14-day Relative Strength Index momentum indicator at 56 stays above the midline, confirming improving momentum. RSI has cooled from prior overbought readings but stabilizes above 50, suggesting dips could stay limited before buyers reassert control.

GBP/USD flat lines as traders await key UK macro data and FOMC minutes

The GBP/USD pair kicks off a new week on a subdued note and oscillates in a narrow range, just below mid-1.3600s, during the Asian session. Moreover, the mixed fundamental backdrop warrants some caution for aggressive traders as the market focus now shifts to this week's important releases from the UK and the US.

Gold slides below $5,000 amid USD uptick and positive risk tone; downside seems limited

Gold attracts fresh sellers at the start of a new week and reverses a part of Friday's strong move up of over $150 from sub-$4,900 levels. The commodity slides back below the $5,000 psychological mark during the Asian session, though the downside potential seems limited amid a combination of supporting factors.

Bitcoin, Ethereum and Ripple consolidate within key ranges as selling pressure eases

Bitcoin and Ethereum prices have been trading sideways within key ranges following the massive correction. Meanwhile, XRP recovers slightly, breaking above the key resistance zone. The top three cryptocurrencies hint at a potential short-term recovery, with momentum indicators showing fading bearish signs.

Global inflation watch: Signs of cooling services inflation

Realized inflation landed close to expectations in January, as negative base effects weighed on the annual rates. Remaining sticky inflation is largely explained by services, while tariff-driven goods inflation remains limited even in the US.

Ripple Price Forecast: XRP potential bottom could be in sight

Ripple edges up above the intraday low of $1.35 at the time of writing on Friday amid mixed price actions across the crypto market. The remittance token failed to hold support at $1.40 the previous day, reflecting risk-off sentiment amid a decline in retail and institutional sentiment.