USD/TRY Price Analysis: Seesaws inside bullish pennant surrounding $8.9000
- USD/TRY holds lower ground inside a bullish chart pattern.
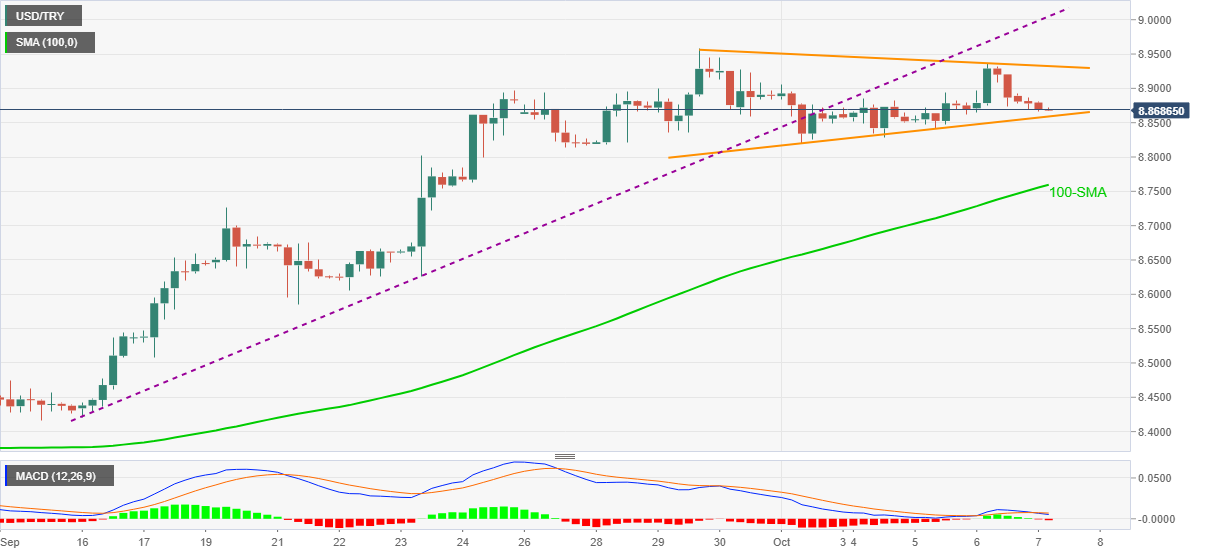
- MACD hints at a short-term pullback, 100-SMA adds to the downside support.
- Recent highs, the previous support line lure the bulls.

USD/TRY remains pressured around the intraday low, down 0.12% on a day close to $8.87 by the press time of the pre-European session on Thursday.
In doing so, the Turkish Lira (TRY) pair takes rounds to a bullish pennant on the four-hour (4H) chart.
Although MACD teases sellers, a pennant’s support near $8.86 would question the short-term downside of the pair, a break of which will highlight the 100-SMA level of $8.76.
Even if the quote drops below $8.76, September 20 swing high surrounding $8.73 will add to the downside filters.
Meanwhile, an upside clearance of $8.93 level will confirm the bullish formation, directing the USD/TRY towards the support-turned-resistance from September 16, near $9.00. It’s worth noting that the latest high of $8.96 act as an extra resistance.
Overall, USD/TRY has more upside potential but the bull may take intermediate rests.
USD/TRY: Four-hour chart
Trend: Bullish
Author

Anil Panchal
FXStreet
Anil Panchal has nearly 15 years of experience in tracking financial markets. With a keen interest in macroeconomics, Anil aptly tracks global news/updates and stays well-informed about the global financial moves and their implications.


