USD/MXN Price Analysis: RSI conditions prod Mexican Peso buyers around 17.53-54 region


  • USD/MXN takes offers to approach 13-day-old horizontal support zone, down for the third consecutive day.
  • Oversold RSI (14) line challenges Mexican Peso pair’s further downside toward yearly bottom.
  • 200-SMA, two-month-old descending resistance line check USD/MXN bulls before giving them control.

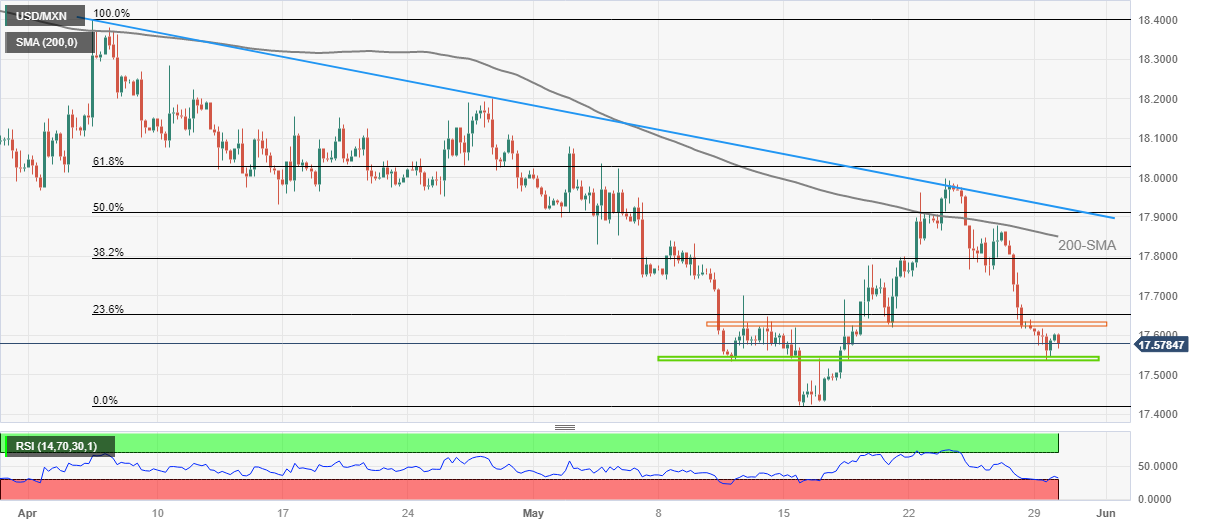
USD/MXN holds lower ground near the lowest levels in a fortnight, mildly offered around 17.57 during early Tuesday in Europe, as it prints a three-day losing streak.

In doing so, the Mexican Peso (MXN) pair approaches a short-term key horizontal support comprising multiple levels marked since May 11, around 17.53-54. Adding strength to the stated horizontal support is the RSI (14) line poking the oversold territory.

Should the USD/MXN pair remains bearish past 17.53, it can quickly prod the yearly low marked the last week around 17.42.

It’s worth noting that the quote’s sustained weakness past 17.42 makes it vulnerable to plunging towards the year 2016 bottom of around 17.05 and then to the 17.00 round figure.

Meanwhile, the USD/MXN pair’s expected recovery appears to have a limited upside room as the 17.62-63 zone, comprising multiple levels marked since May 11, guards the immediate rise.

Following that, the 200-SMA hurdle of 17.85 and a descending resistance line from early April, close to 17.92, can challenge the pair buyers ahead of directing them to the 18.00 round figure.

Overall, USD/MXN is likely to recover but the upside room appears limited.

USD/MXN: Four-hour chart

Trend: Limited downside expected

Additional important levels

Overview
Today last price 17.574
Today Daily Change -0.0186
Today Daily Change % -0.11%
Today daily open 17.5926
 
Trends
Daily SMA20 17.7332
Daily SMA50 17.9863
Daily SMA100 18.3068
Daily SMA200 19.0323
 
Levels
Previous Daily High 17.639
Previous Daily Low 17.5348
Previous Weekly High 17.9981
Previous Weekly Low 17.6165
Previous Monthly High 18.4018
Previous Monthly Low 17.9329
Daily Fibonacci 38.2% 17.5746
Daily Fibonacci 61.8% 17.5992
Daily Pivot Point S1 17.5386
Daily Pivot Point S2 17.4846
Daily Pivot Point S3 17.4344
Daily Pivot Point R1 17.6428
Daily Pivot Point R2 17.693
Daily Pivot Point R3 17.747


Share: Feed news

Information on these pages contains forward-looking statements that involve risks and uncertainties. Markets and instruments profiled on this page are for informational purposes only and should not in any way come across as a recommendation to buy or sell in these assets. You should do your own thorough research before making any investment decisions. FXStreet does not in any way guarantee that this information is free from mistakes, errors, or material misstatements. It also does not guarantee that this information is of a timely nature. Investing in Open Markets involves a great deal of risk, including the loss of all or a portion of your investment, as well as emotional distress. All risks, losses and costs associated with investing, including total loss of principal, are your responsibility. The views and opinions expressed in this article are those of the authors and do not necessarily reflect the official policy or position of FXStreet nor its advertisers. The author will not be held responsible for information that is found at the end of links posted on this page.

If not otherwise explicitly mentioned in the body of the article, at the time of writing, the author has no position in any stock mentioned in this article and no business relationship with any company mentioned. The author has not received compensation for writing this article, other than from FXStreet.

FXStreet and the author do not provide personalized recommendations. The author makes no representations as to the accuracy, completeness, or suitability of this information. FXStreet and the author will not be liable for any errors, omissions or any losses, injuries or damages arising from this information and its display or use. Errors and omissions excepted.

The author and FXStreet are not registered investment advisors and nothing in this article is intended to be investment advice.

Recommended content


Recommended content

Editors’ Picks

EUR/USD holds above 1.0700 ahead of key US data

EUR/USD holds above 1.0700 ahead of key US data

EUR/USD trades in a tight range above 1.0700 in the early European session on Friday. The US Dollar struggles to gather strength ahead of key PCE Price Index data, the Fed's preferred gauge of inflation, and helps the pair hold its ground. 

EUR/USD News

USD/JPY stays above 156.00 after BoJ Governor Ueda's comments

USD/JPY stays above 156.00 after BoJ Governor Ueda's comments

USD/JPY holds above 156.00 after surging above this level with the initial reaction to the Bank of Japan's decision to leave the policy settings unchanged. BoJ Governor said weak Yen was not impacting prices but added that they will watch FX developments closely.

USD/JPY News

Gold price oscillates in a range as the focus remains glued to the US PCE Price Index

Gold price oscillates in a range as the focus remains glued to the US PCE Price Index

Gold price struggles to attract any meaningful buyers amid the emergence of fresh USD buying. Bets that the Fed will keep rates higher for longer amid sticky inflation help revive the USD demand.

Gold News

Sei Price Prediction: SEI is in the zone of interest after a 10% leap

Sei Price Prediction: SEI is in the zone of interest after a 10% leap

Sei price has been in recovery mode for almost ten days now, following a fall of almost 65% beginning in mid-March. While the SEI bulls continue to show strength, the uptrend could prove premature as massive bearish sentiment hovers above the altcoin’s price.

Read more

US core PCE inflation set to signal firm price pressures as markets delay Federal Reserve rate cut bets

US core PCE inflation set to signal firm price pressures as markets delay Federal Reserve rate cut bets

The core PCE Price Index, which excludes volatile food and energy prices, is seen as the more influential measure of inflation in terms of Fed positioning. The index is forecast to rise 0.3% on a monthly basis in March, matching February’s increase. 

Read more

Forex MAJORS

Cryptocurrencies

Signatures