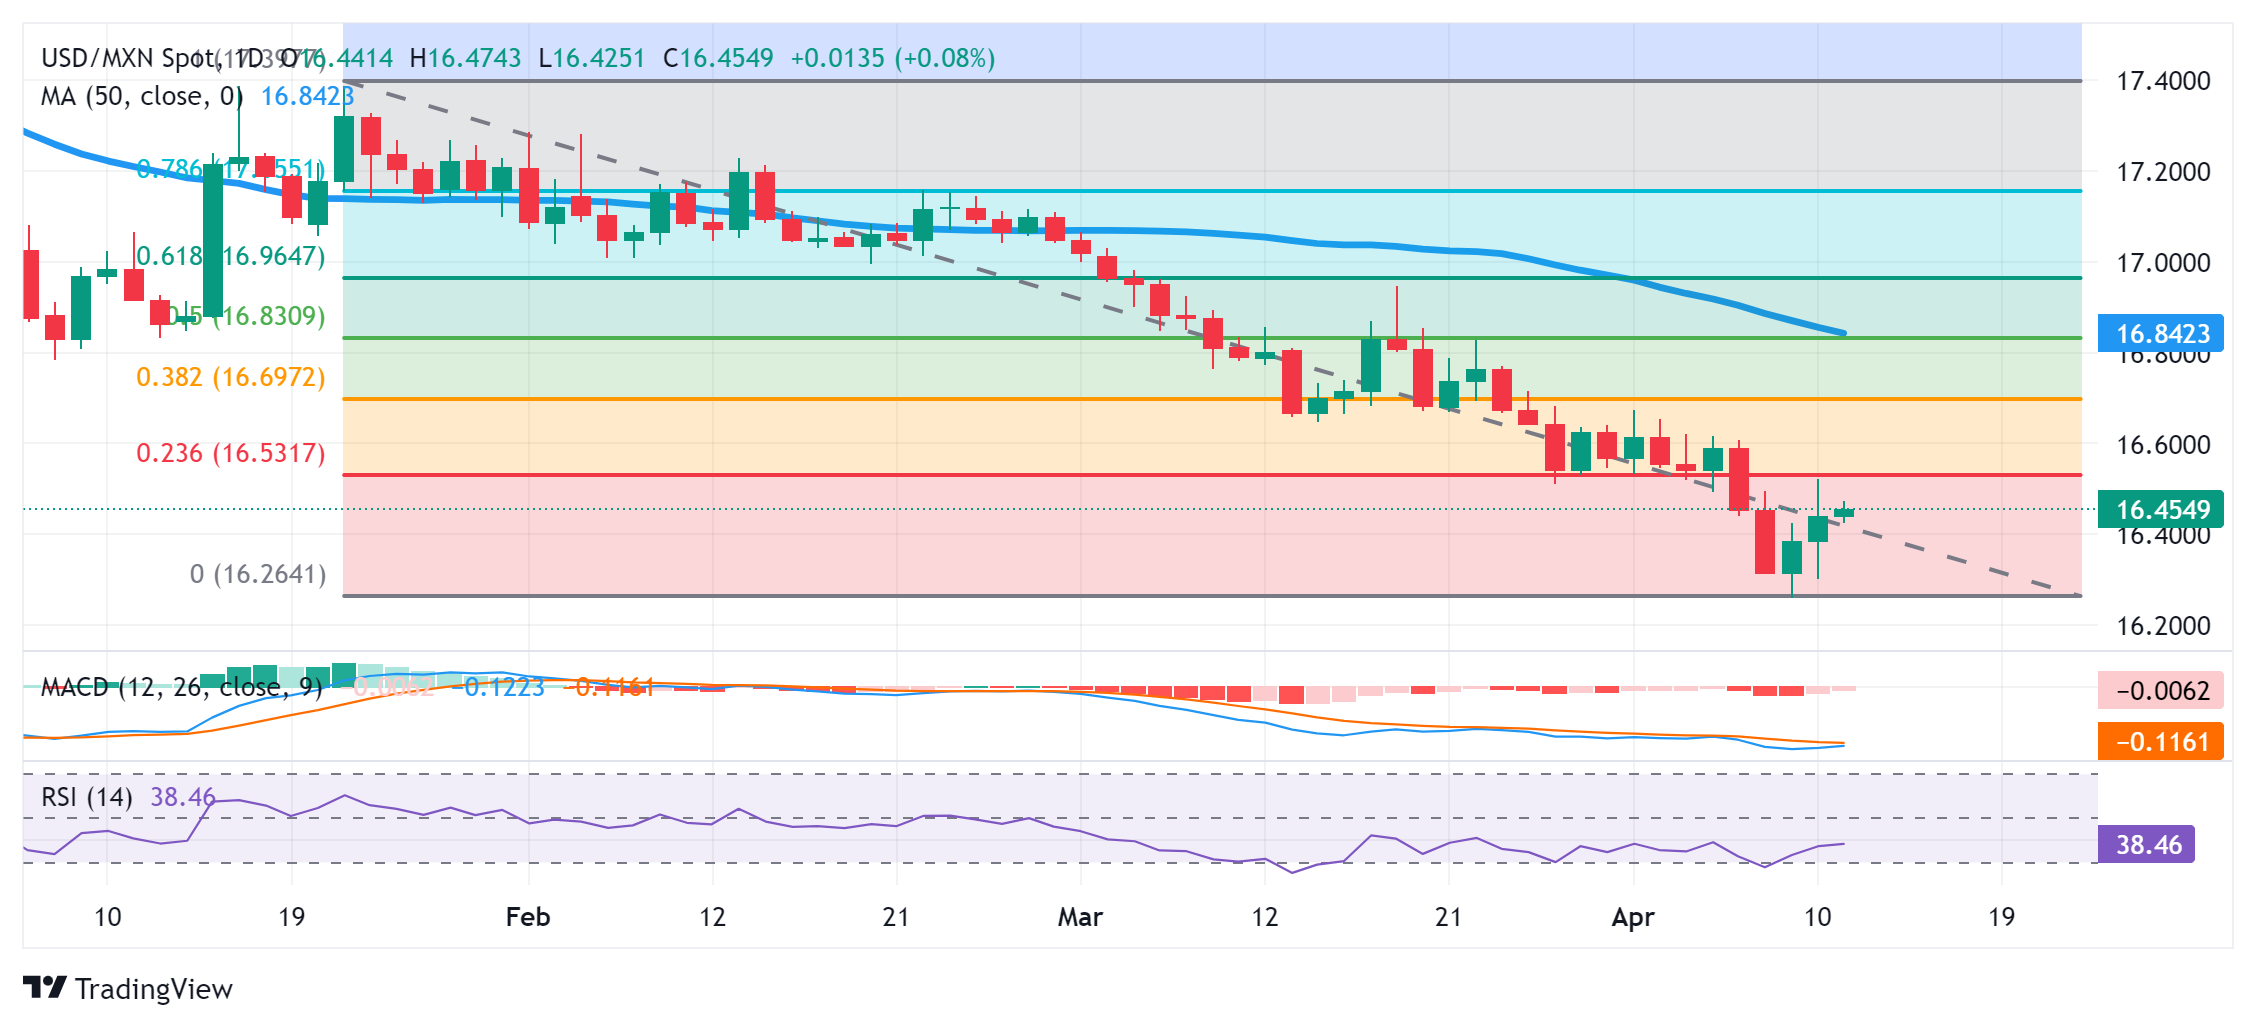
USD/MXN Price Analysis: Remains below 23.6% Fibo. hurdle near mid-16.00s, or weekly high


  • USD/MXN trades with a positive bias for the third straight day, albeit lacks follow-through.
  • The technical setup supports prospects for the emergence of fresh selling at higher levels.
  • Reduced Fed rate cut bets continue to underpin the USD and should limit the downside.

The USD/MXN pair attracts some buyers for the third successive day on Thursday, albeit lacks bullish conviction and remains below the weekly top, around the 16.50-16.55 area touched the previous day.

The aforementioned area represents the 23.6% Fibonacci retracement level of the January-April downfall and should act as a key pivotal point for short-term traders. A sustained strength beyond might trigger a short-covering rally and lift the USD/MXN pair to the next relevant hurdle near the 16.65-16.70 supply zone, or the 38.2% Fibo. level. Some follow-through buying should pave the way for a move towards challenging the 16.85 confluence hurdle, comprising the 100-day Simple Moving Average (SMA) and the 50% Fibo. level.

Meanwhile, technical indicators on the daily chart – though have been recovering – are still holding in the negative territory and suggest that any meaningful upside might still be seen as a selling opportunity. This, in turn, warrants some caution for bullish traders and before confirming that the USD/MXN pair has bottomed out in the near term. In the meantime, the 16.30-16.25 area, or the lowest level since August 2015, is likely to protect the immediate downside, below which spot prices could slide to test the 16.00 round-figure mark.

The hotter US consumer inflation figures released on Wednesday forced investors to push back expectations for the first interest rate cut to September from June. Moreover, the markets are now pricing in the possibility of less than two 25 basis point rate cuts in 2024, which assists the US Dollar (USD) to stand tall near the YTD peak. This should assist the USD/MXN pair to defend the aforementioned handle, which if broken decisively should pave the way for the extension of an over a two-month-old downtrend witnessed from the YTD peak touched in January.

USD/MXN daily chart

fxsoriginal

USD/MXN

Overview
Today last price 16.4575
Today Daily Change 0.0161
Today Daily Change % 0.10
Today daily open 16.4414
 
Trends
Daily SMA20 16.609
Daily SMA50 16.8549
Daily SMA100 16.9958
Daily SMA200 17.1756
 
Levels
Previous Daily High 16.5213
Previous Daily Low 16.3021
Previous Weekly High 16.6737
Previous Weekly Low 16.4403
Previous Monthly High 17.0655
Previous Monthly Low 16.5116
Daily Fibonacci 38.2% 16.4375
Daily Fibonacci 61.8% 16.3858
Daily Pivot Point S1 16.3219
Daily Pivot Point S2 16.2024
Daily Pivot Point S3 16.1027
Daily Pivot Point R1 16.5411
Daily Pivot Point R2 16.6408
Daily Pivot Point R3 16.7602


Share: Feed news

Information on these pages contains forward-looking statements that involve risks and uncertainties. Markets and instruments profiled on this page are for informational purposes only and should not in any way come across as a recommendation to buy or sell in these assets. You should do your own thorough research before making any investment decisions. FXStreet does not in any way guarantee that this information is free from mistakes, errors, or material misstatements. It also does not guarantee that this information is of a timely nature. Investing in Open Markets involves a great deal of risk, including the loss of all or a portion of your investment, as well as emotional distress. All risks, losses and costs associated with investing, including total loss of principal, are your responsibility. The views and opinions expressed in this article are those of the authors and do not necessarily reflect the official policy or position of FXStreet nor its advertisers. The author will not be held responsible for information that is found at the end of links posted on this page.

If not otherwise explicitly mentioned in the body of the article, at the time of writing, the author has no position in any stock mentioned in this article and no business relationship with any company mentioned. The author has not received compensation for writing this article, other than from FXStreet.

FXStreet and the author do not provide personalized recommendations. The author makes no representations as to the accuracy, completeness, or suitability of this information. FXStreet and the author will not be liable for any errors, omissions or any losses, injuries or damages arising from this information and its display or use. Errors and omissions excepted.

The author and FXStreet are not registered investment advisors and nothing in this article is intended to be investment advice.

Recommended content


Recommended content

Editors’ Picks

AUD/USD retargets the 0.6600 barrier and above

AUD/USD retargets the 0.6600 barrier and above

AUD/USD extended its positive streak for the sixth session in a row at the beginning of the week, managing to retest the transitory 100-day SMA near 0.6580 on the back of the solid performance of the commodity complex.

AUD/USD News

EUR/USD keeps the bullish bias above 1.0700

EUR/USD keeps the bullish bias above 1.0700

EUR/USD rapidly set aside Friday’s decline and regained strong upside traction in response to the marked retracement in the Greenback following the still-unconfirmed FX intervention by the Japanese MoF.

EUR/USD News

Gold advances for a third consecutive day

Gold advances for a third consecutive day

Gold fluctuates in a relatively tight channel above $2,330 on Monday. The benchmark 10-year US Treasury bond yield corrects lower and helps XAU/USD limit its losses ahead of this week's key Fed policy meeting.

Gold News

Bitcoin price dips to $62K range despite growing international BTC validation via spot ETFs

Bitcoin price dips to $62K range despite growing international BTC validation via spot ETFs

Bitcoin (BTC) price closed down for four weeks in a row, based on the weekly chart, and could be on track for another red candle this week. The last time it did this was in the middle of the bear market when it fell by 42% within a span of nine weeks. 

Read more

Japan intervention: Will it work?

Japan intervention: Will it work?

Dear Japan Intervenes in the Yen for the first time since November 2022 Will it work? Have we seen a top in USDJPY? Let's go through the charts.

Read more

Forex MAJORS

Cryptocurrencies

Signatures