|

USD/MXN Price Analysis: Juggles below 18.40 as investors await US PCE Inflation

  • USD/MXN is oscillating in a narrow range below 18.40 ahead of US PCE Inflation.
  • S&P500 futures have recovered their entire morning losses, portraying a rebound in the risk-appetite theme.
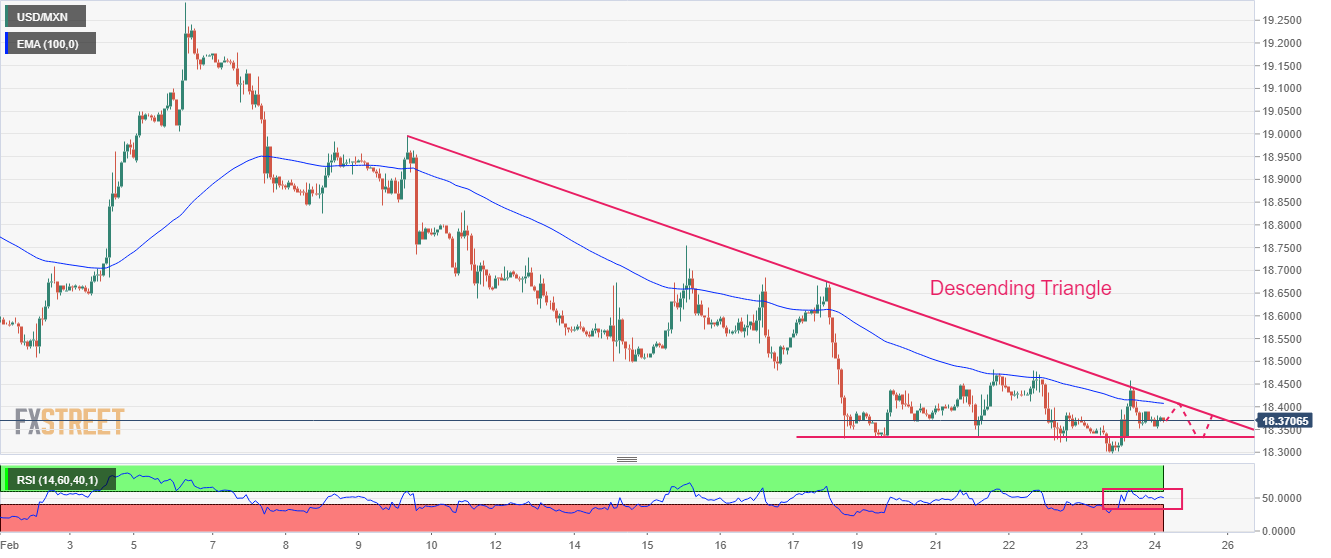
  • USD/MXN is auctioning in a Descending Triangle that indicates a sheer contraction in volatility.

The USD/MXN pair is displaying a back-and-forth action in a narrow range of 18.36-18.38 in the Asian session. The asset has turned sideways as investors are awaiting the release of the Federal Reserve’s (Fed) preferred inflation tool. The United States Personal Consumption Expenditure (PCE) Price Index annual figure is seen higher at 4.3% vs. the former release of 4.4%. An occurrence in the same will dismantle the discussions of a pause in the policy tightening spell.

The US Dollar Index (DXY) is showing a subdued performance as investors have started ignoring the impact of more interest rate announcements by the Federal Reserve (Fed). Meanwhile, S&P500 futures have recovered their entire morning losses, portraying a rebound in the risk-appetite theme.

USD/MXN is auctioning in a Descending Triangle chart pattern on an hourly scale, which indicates a sheer contraction in volatility. The downward-sloping trendline of the chart pattern is plotted from February 9 high around 19.00 while the horizontal support is placed from February 17 low at 18.33.

The 100-period Exponential Moving Average (EMA) at 18.40 is acting as a major barricade for the Mexican Peso bulls.

Meanwhile, the Relative Strength Index (RSI) (14) is oscillating in a 40.00-60.00 range, which indicates an absence of a potential trigger.

Should the asset break above February 23 high at 18.46 confidently, US Dollar bulls will drive the asset toward February 17 high at 18.67 followed by February 15 high at 18.75.

Alternatively, a break below February 23 low at 18.29 will drag the asset toward 5 April 2018 low at 18.05. A slippage below the latter will further drag the asset toward 17 April 2018 low at 17.93.

USD/MXN hourly chart

USD/MXN

Overview
Today last price18.3713
Today Daily Change0.0063
Today Daily Change %0.03
Today daily open18.365
 
Trends
Daily SMA2018.6594
Daily SMA5018.9856
Daily SMA10019.3235
Daily SMA20019.7289
 
Levels
Previous Daily High18.4577
Previous Daily Low18.2984
Previous Weekly High18.754
Previous Weekly Low18.3306
Previous Monthly High19.5361
Previous Monthly Low18.5663
Daily Fibonacci 38.2%18.3592
Daily Fibonacci 61.8%18.3968
Daily Pivot Point S118.2896
Daily Pivot Point S218.2143
Daily Pivot Point S318.1303
Daily Pivot Point R118.449
Daily Pivot Point R218.533
Daily Pivot Point R318.6083

Author

Sagar Dua

Sagar Dua

FXStreet

Sagar Dua is associated with the financial markets from his college days. Along with pursuing post-graduation in Commerce in 2014, he started his markets training with chart analysis.

More from Sagar Dua
Share:

Markets move fast. We move first.

Orange Juice Newsletter brings you expert driven insights - not headlines. Every day on your inbox.

By subscribing you agree to our Terms and conditions.

Editor's Picks

EUR/USD extends slide below 1.1700

The EUR/USD pair nears its weekly low at around 1.1660 in the American session on Tuesday, retreating from the 1.1750 price zone tested earlier in the day. Cautiously optimistic markets support the US Dollar in the near term.

GBP/USD retreats from three-month-high, pierces 1.3500

GBP/USD extends its intraday slide and trades in the red just below 1.3500 after setting a new three-month-high near 1.3570. Ahead of this week's key employment data releases from the US, markets recover the good mood.

Gold extends upside to near $4,500 on Venezuela turmoil

Gold price climbs to near $4,500 during the early Asian trading hours on Wednesday. The precious metal rises by more than 1% in the day as geopolitical tensions and expectations of US rate cuts keep demand for gold high. The US ISM Services Purchasing Managers Index report will be published on Wednesday. 

Australia CPI likely to test RBA hawkishness

The Australian Bureau of Statistics will publish the Consumer Price Index data for November at 00:30 GMT on Wednesday. This is the second complete monthly CPI report, as the government continues to transition from the quarterly CPI to the monthly gauge as the primary measure of headline inflation.

Implications of US intervention in Venezuela

Events in Venezuela are top of mind for market participants, and while developments are associated with an elevated degree of uncertainty, we are not making any changes to our markets or economic forecasts as a result of the deposition of Nicolás Maduro. 

Cardano holds steady as bulls intensify push for breakout

Cardano rises above the 50-day EMA resistance amid a risk-on mood across the crypto market. The MACD upholds positive divergence, increasing the potential for a 20% breakout to $0.505.