|

USD/MXN Price Analysis: Hangs near multi-year low, bears retain control below 17.0000 mark

  • USD/MXN consolidates in a range below the 17.0000 mark through the Asian session on Thursday.
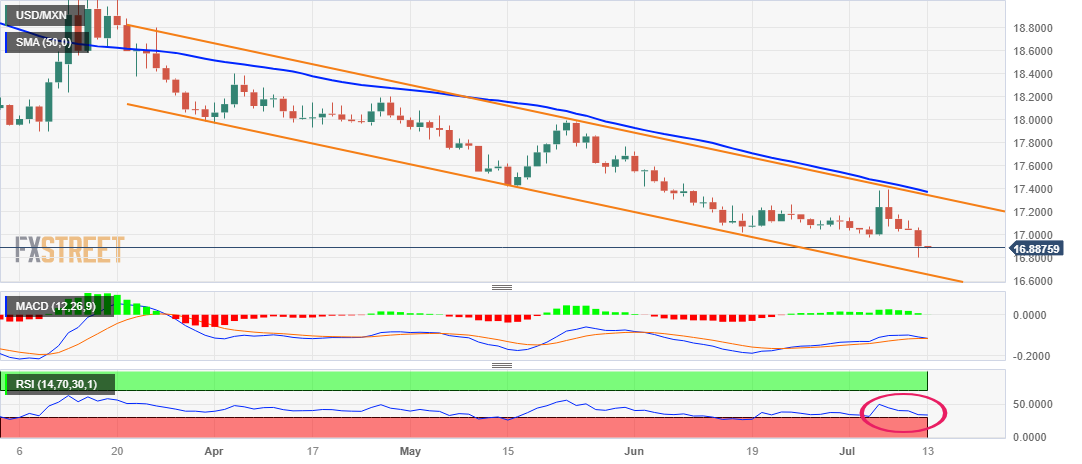
  • The formation of the descending channel and the recent price action still favours bearish traders.
  • The RSI on the daily chart is on the verge of breaking into the oversold zone and warrants caution.

The USD/MXN pair struggles to capitalize on the previous day's modest bounce from the 16.8085 region, or its lowest level since December 2015 and oscillates in a narrow trading band through the Asian session on Thursday. Spot prices, meanwhile, now seem to have found acceptance below the 17.0000 mark and remain vulnerable to depreciate further.

The decline witnessed over the past three months or so has been along a downward-sloping channel, which points to a well-established short-term bearish trend. Furthermore, the recent failure near the trend-channel resistance, which coincides with the 50-day Simple Moving Average (SMA), and the subsequent slide validates the negative outlook for the USD/MXN pair. That said, the Relative Strength Index (RSI) on the daily chart has moved on the verge of breaking into the oversold zone and warrants some caution.

Hence, any further decline below the overnight swing low is more likely to find support near the lower end of the aforementioned channel, currently pegged around the 16.6750 area. A convincing breakdown below, however, will be seen as a fresh trigger for bearish traders and set the stage for an extension of a one-year-old downtrend.

On the flip side, any meaningful recovery now seems to confront stiff resistance near the 17.0000 horizontal support breakpoint. This is followed by the 17.0500 hurdle, which if cleared decisively might trigger a short-covering rally and lift the USD/MXN pair towards the 17.1200 intermediate barrier. The momentum could get extended further towards the next relevant resistance near the 17.1790-17.1800 region en route to the 17.2420-17.2430 supply zone.

USD/MXN daily chart

fxsoriginal

Key levels to watch

USD/MXN

Overview
Today last price16.8848
Today Daily Change-0.0172
Today Daily Change %-0.10
Today daily open16.902
 
Trends
Daily SMA2017.1012
Daily SMA5017.3945
Daily SMA10017.8178
Daily SMA20018.5794
 
Levels
Previous Daily High17.0645
Previous Daily Low16.8085
Previous Weekly High17.3957
Previous Weekly Low16.9803
Previous Monthly High17.7286
Previous Monthly Low17.0243
Daily Fibonacci 38.2%16.9063
Daily Fibonacci 61.8%16.9667
Daily Pivot Point S116.7855
Daily Pivot Point S216.669
Daily Pivot Point S316.5295
Daily Pivot Point R117.0415
Daily Pivot Point R217.181
Daily Pivot Point R317.2975

Author

Haresh Menghani

Haresh Menghani is a detail-oriented professional with 10+ years of extensive experience in analysing the global financial markets.

More from Haresh Menghani
Share:

Markets move fast. We move first.

Orange Juice Newsletter brings you expert driven insights - not headlines. Every day on your inbox.

By subscribing you agree to our Terms and conditions.

Editor's Picks

EUR/USD holds steady above 1.1750 as traders await FOMC Minutes

The EUR/USD pair holds steady near 1.1770 during the early Asian session on Tuesday. Traders continue to price in the prospect of further rate cuts by the US Federal Reserve in 2026, following the 25-basis-point rate reduction delivered at the December meeting. The release of the Federal Open Market Committee Minutes will be in the spotlight later on Tuesday.

GBP/USD finds key support near 1.35 despite year-end grind

GBP/USD remains bolstered on the high end as markets grind through the last trading week of the year. Cable caught a bullish tilt to keep price action on the high side of the 1.3500 handle, though year-end holiday volumes are unlikely to see significant progress in either direction as 2025 draws to a close.

Gold holds above $4,300 after setting yet another record high

Spot Gold traded as high as $4,550 a troy ounce on Monday, fueled by persistent US Dollar weakness and a dismal mood. The XAU/USD pair was hit sharply by profit-taking during US trading hours and retreated towards $4,300, where buyers reappeared.

Crypto market outlook for 2026

Year 2025 was volatile, as crypto often is.  Among positive catalysts were favourable regulatory changes in the U.S., rise of Digital Asset Treasuries, adoption of AI and tokenization of Real-World-Assets.

Economic outlook 2026-2027 in advanced countries: Solidity test

After a year marked by global economic resilience and ending on a note of optimism, 2026 looks promising and could be a year of solid economic performance. In our baseline scenario, we expect most of the supportive factors at work in 2025 to continue to play a role in 2026.

Crypto market outlook for 2026

Year 2025 was volatile, as crypto often is.  Among positive catalysts were favourable regulatory changes in the U.S., rise of Digital Asset Treasuries (DAT), adoption of AI and tokenization of Real-World-Assets (RWA).