USD/MXN climbs amid soft Mexican GDP, mixed US economic data
- Mexico’s Q2 GDP growth comes in below expectations at 0.8% QoQ, pushing USD/MXN higher as Banxico holds rates steady at 11.25%.
- US Job Openings declined to 8.827M, well below estimates, causing odds for a September rate hike to drop from 78% to 86.5%, according to the CME FedWatch Tool.
- Despite mixed US economic data, inflation remains a concern; upcoming Nonfarm Payrolls could be pivotal for the USD/MXN pair as recessionary fears loom.

The Mexican Peso (MXN) loses ground against the US Dollar (USD) as economic data in Mexico was soft, even though the agenda in the United States (US) increased speculation the US Federal Reserve (Fed) could pause its tightening cycle in September. However, the USD/MXN reversed its course climbs by 0.51%, trading at 16.8659, after hitting a daily low of 16.7533.
Mexican economy grows less than estimates; US JOLTs and Consumer Confidence slide
According to the Instituto Nacional de Estadistica Geografia e Informatica (INEGI), Mexico’s economy grew slower than expected. Gross Domestic Product (GDP) for Q2 2023 came at 0.8% QoQ, below forecasts of 1%, and in annually-based figures at 3.6% from 3.7% expected. Sources cited by Reuters commented that “tighter financial conditions and the weakness of key sectors …are now a clear drag.” After the data, the USD/MXN extended its gains. Traders must be aware that the Bank of Mexico (Banxico) kept borrowing costs unchanged at their last decision at 11.25%, stating that rates would remain higher for an extended period.
Across the border, the US economic docket revealed that Job Openings declined from 9.165M in June to 8.827M in July, well below estimates of 9.465M, as the Bureau of Labor Statistics (BLS) reported. Given that Fed Chair Jerome Powell stressed that should the labor market continue to loosen, inflation would continue its downtrend, expectations for September’s rate hike faded. The CME FedWatch Tool shows odds for keeping rates unchanged at 5.25%-5.50%, jumped from 78% to 86.5% in one day.
Other data revealed simultaneously by the Conference Board (CB) showed that Consumer Confidence is deteriorating, falling to 106.1 this month from 114 in July, even though estimates were at 116. According to Dana Peterson, chief economist at the Conference Board, “Consumers were once again preoccupied with rising prices in general, and for groceries and gasoline in particular.”
The report highlighted that inflation expectations for a year ahead jumped to 5.8%. The CB poll showed Americans are confident about finding a job, which shows the labor market is beginning to feel the pain of 525 basis points of tightening by the Fed.
Despite today’s data showing the US economy is decelerating, inflation remains high. Given that Jerome Powell, in his last speech, revealed that a couple of good inflation reports are not enough to stir the US central bank from tightening policy, next Friday’s US Nonfarm Payrolls report could be decisive in dictating the path of the US Dollar.
For the USD/MXN, if the US economy decelerates further and recessionary fears reignite, it could weaken the emerging market currency. Hence, further upside is expected in the pair, as traders would move to a risk-off environment and seek the safety of the US Dollar.
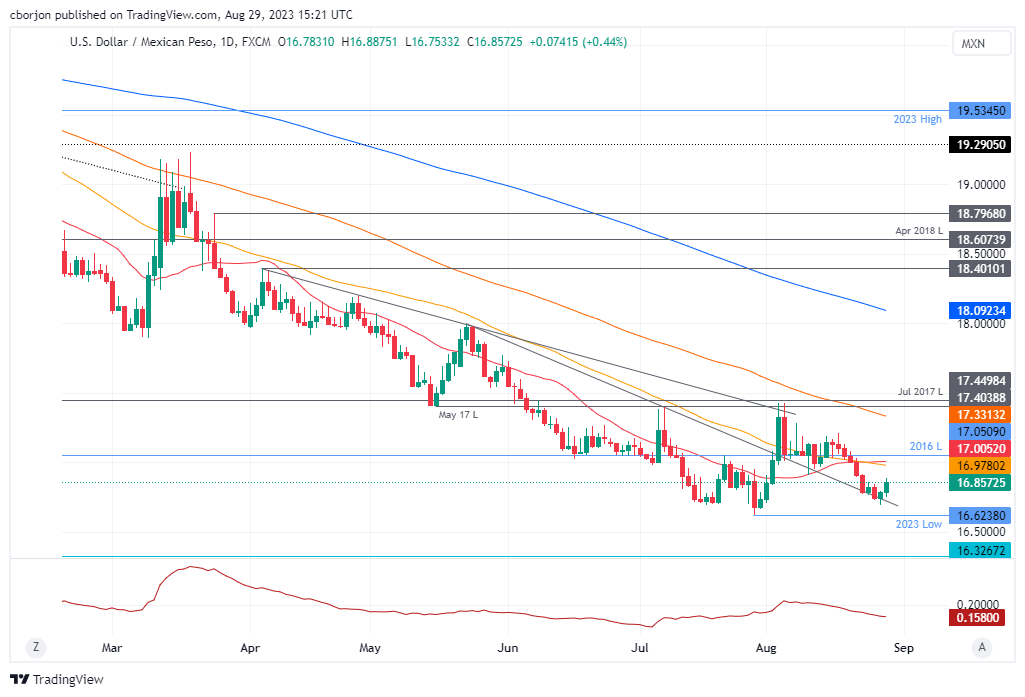
USD/MXN Price Analysis: Technical outlook
The USD/MXN daily chart portrays the pair as in an upward correction toward the confluence of the 50 and the 20-day Moving Average (DMA) at around 16.9778-17.0047, following the data. Still, buyers must achieve a daily close above August’s 23 high of 16.9151 to remain hopeful for higher prices. Downside risks emerge at the current week’s low of 16.6923 and the year-to-date (YTD) low of 16.6238.
Author

Christian Borjon Valencia
FXStreet
Markets analyst, news editor, and trading instructor with over 14 years of experience across FX, commodities, US equity indices, and global macro markets.


