USD/JPY's Price Analysis: Weekly and daily pin bars are highly bearish
- Bears take charge and are testing below critical support structures across the timelines.
- USD/JPY has been pressured by a chorus of concerning headlines surrounding the Ukraine crisis.

USD/JPY is under pressure as the yen picks up a safe-haven bid amid the latest bullish developments for the currency pertaining to the onset of war between Russia and the West.
Following news that Russian President Vladimir Putin had sent troops into separatist regions of Ukraine, the prospects of a deeper infiltration into the country was announced just after the Wall Street open by the United States of America. According to US intelligence, Russia will invade within 48hrs.
Further reports enhanced the risk-off moves on Wednesday that cited convoys of military equipment moving towards Donetsk in eastern Ukraine from the direction of the Russian Frontier. Consequently, Ukraine has planned to declare a state of emergency and the yen started to breakdown the hourly support vs the US dollar as follows:
USD/JPY H1 chart
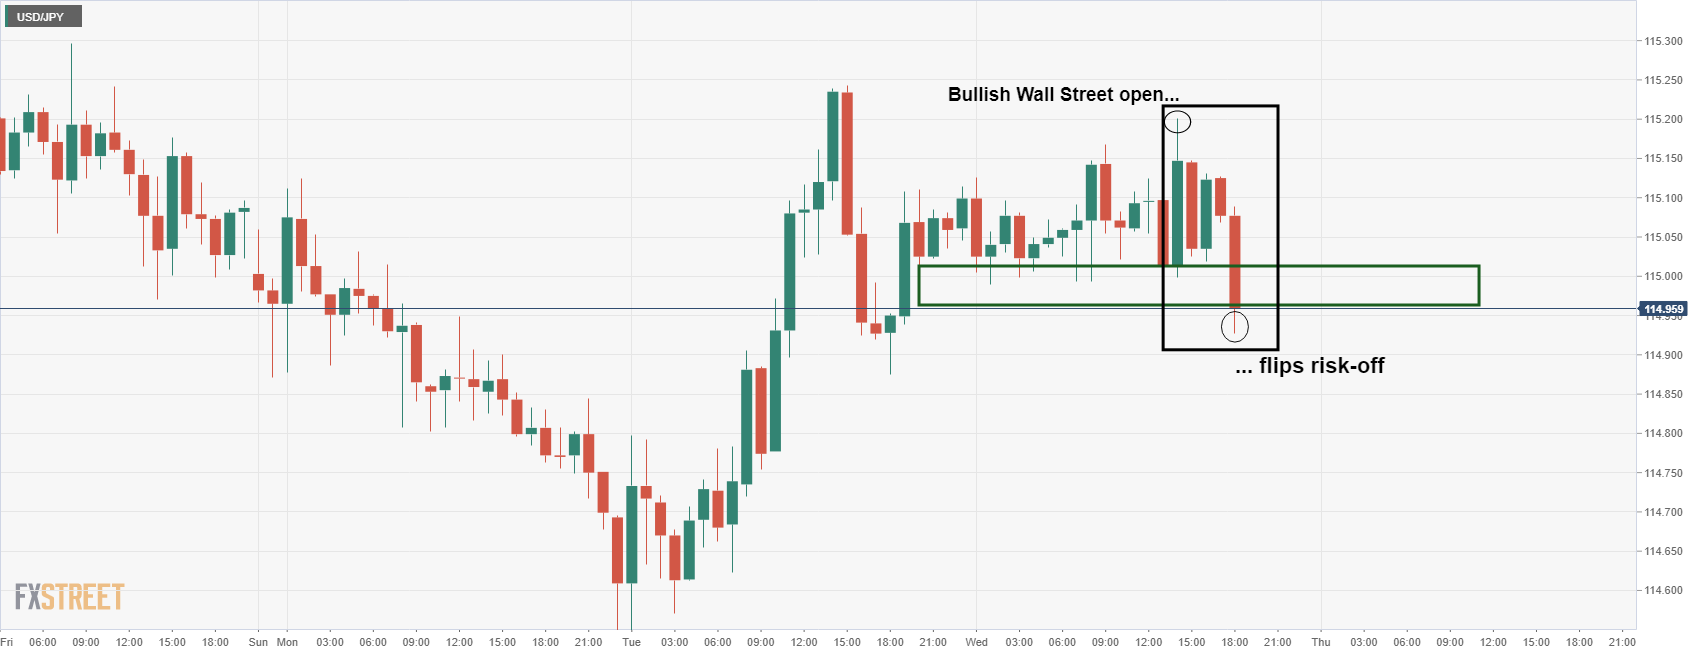
The price action on the hourly time frame is making for a bearish structure, confirming the bias:
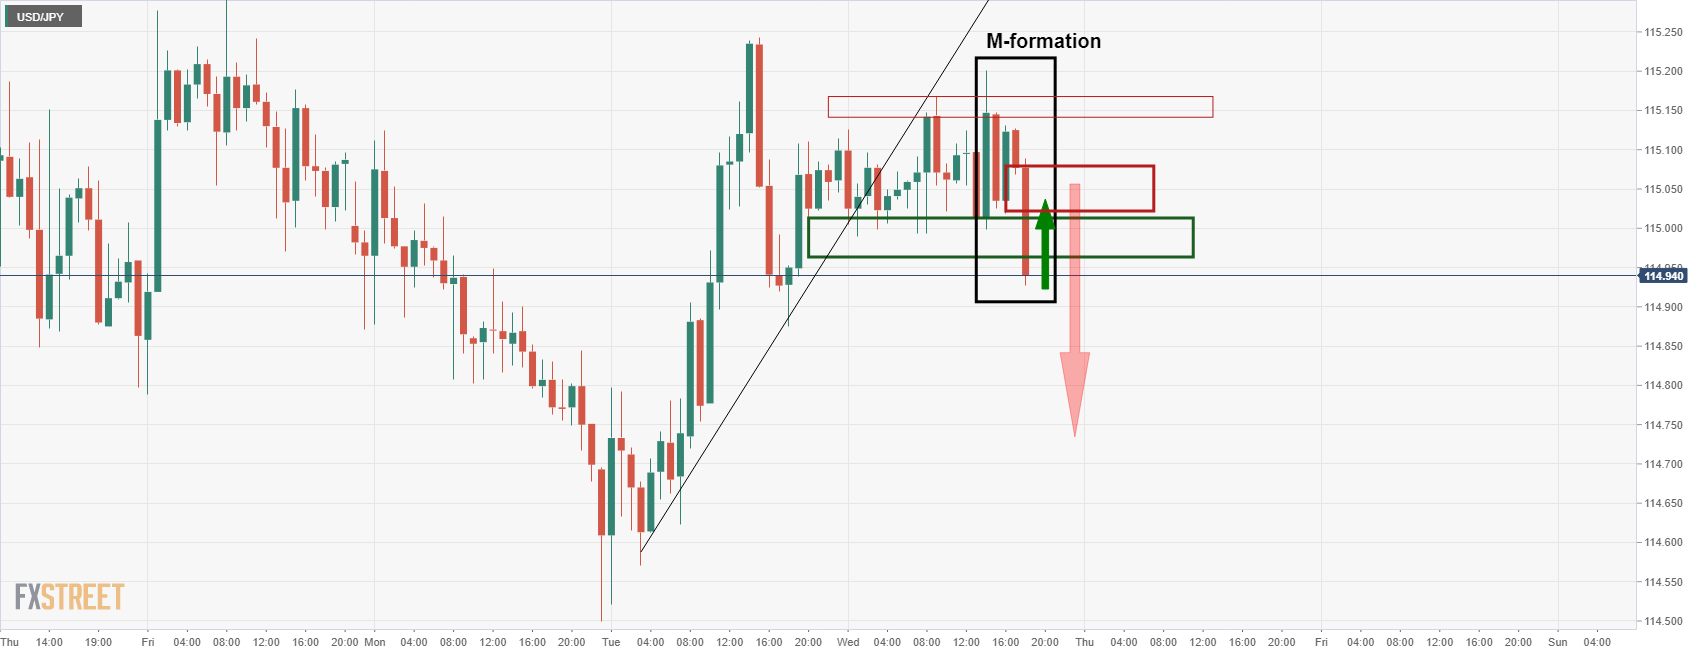
The M-formation would be expected to pull in the bulls for a restest to the neckline near 115.05/15. This resistance would be expected to equate to a full-on breakout below the counter-trend lines and the sideways topping structure that has been building over the course of this week.
Meanwhile, from a longer-term perspective, the week and daily price action and market structure also give us a few clues on where the bias is on a technical basis.
USD/JPY weekly chart
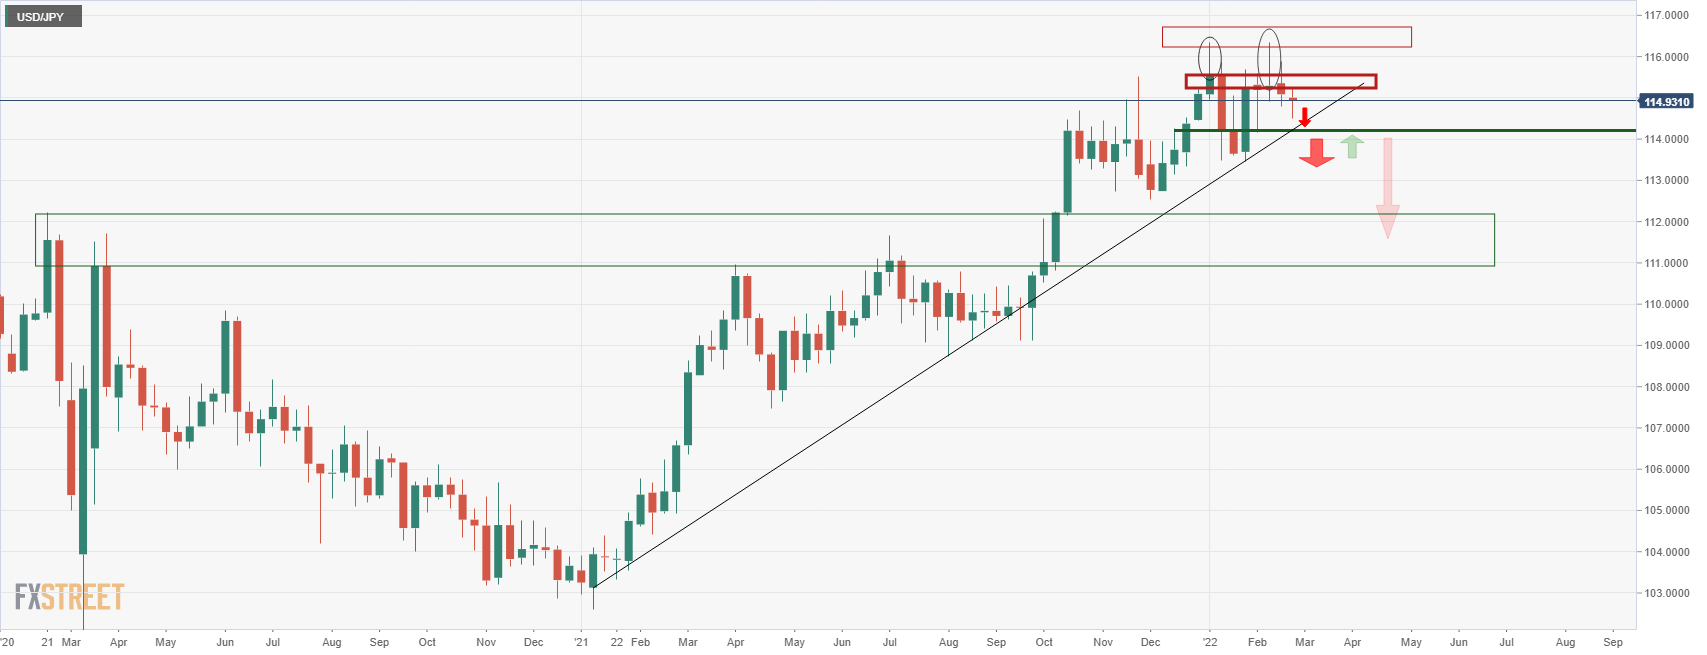
The weekly chart has been giving signs of bullish exhaustion since the middle of the month with the weekly wicks left unfilled by subsequent weeks of trading activity. The Bulls are tired and are throwing in the towel.
Additionally, the daily chart shows the bulls are losing the battle to the bears as follows:
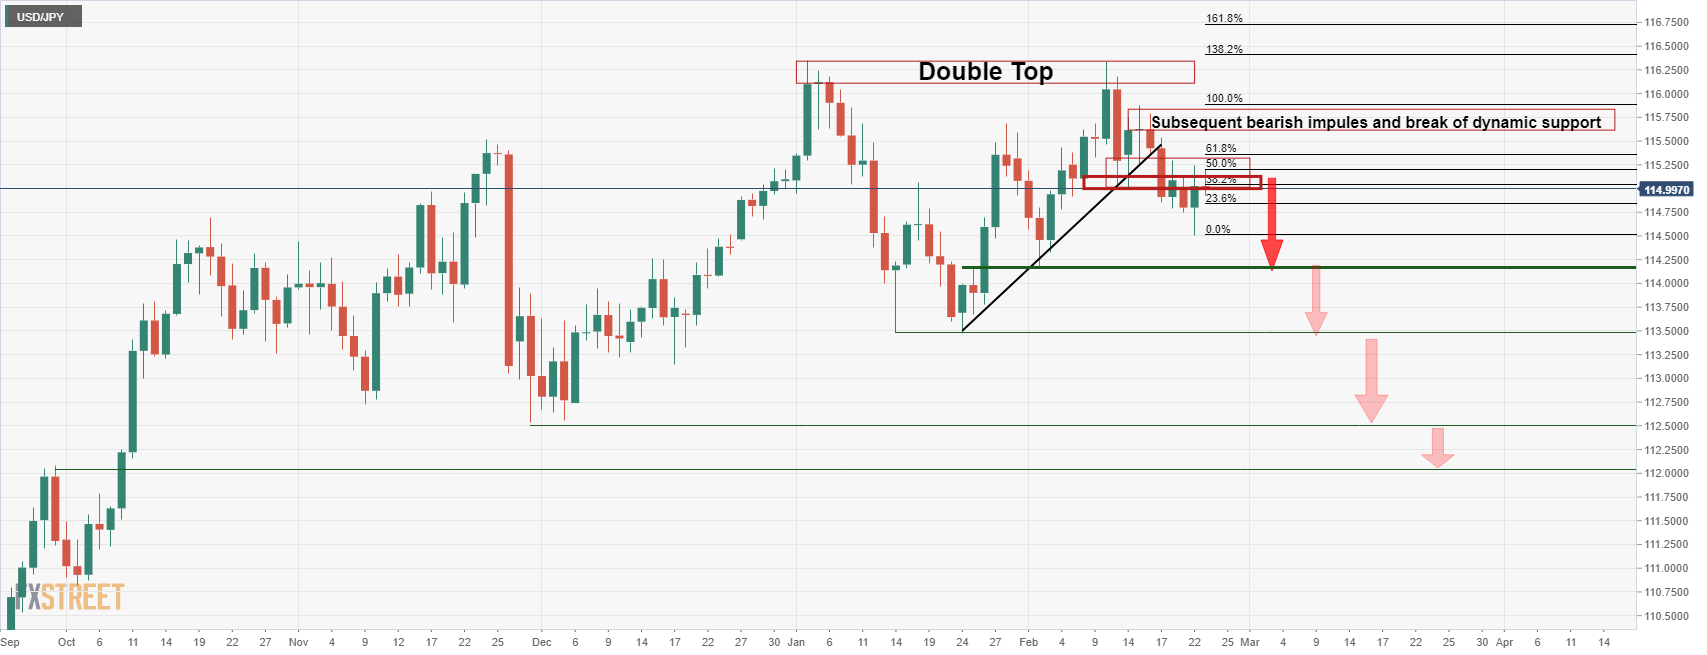
USD/JPY daily chart
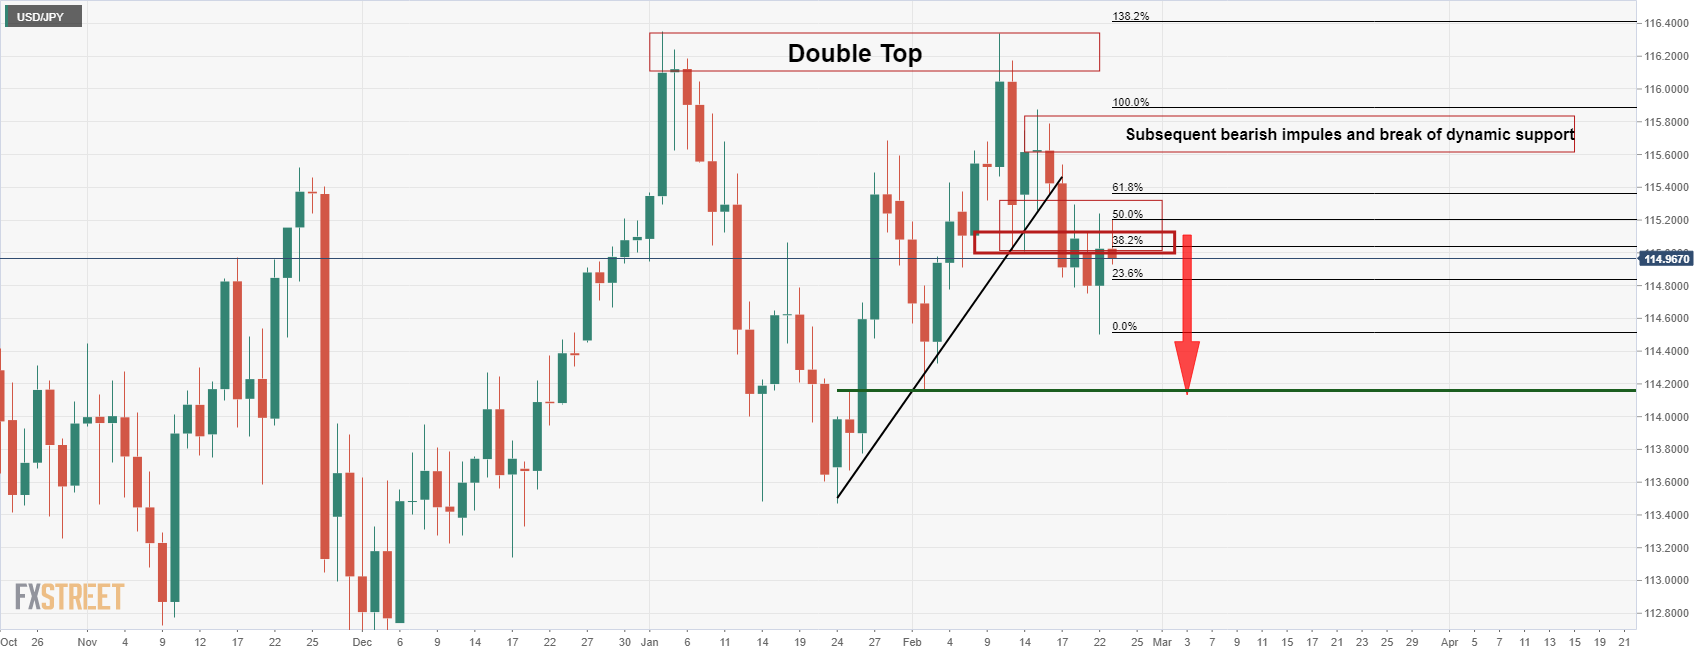
The above analysis illustrates the bearish bias given the series of bearish events in price action since the double top was accompanied by a bearish engulfing close on Feb. 11. We have since seen a break of the trendline support and retests back into the cluster of offers below 115.30.
The price is failing there and near a 50% mean reversion of the bearish impulse that broke the dynamic support. This leaves the attention on the downside towards 114.20 for the days ahead as the last defence for much lower levels:
When considering the Japanese fiscal year-end seasonal flows from Japanese exporters buying at the end of their financial year, the accumulation of short positions against the dollar looks vulnerable to a further squeeze over the coming weeks.
Author

Ross J Burland
FXStreet
Ross J Burland, born in England, UK, is a sportsman at heart. He played Rugby and Judo for his county, Kent and the South East of England Rugby team.

















