|

USD/JPY soars as Fed Powell’s hawkish stance fuels tightening speculations

  • Powell’s hawkish tone on inflation and rate hikes sends USD/JPY whipsawing, eyeing a test of the year-to-date high of 146.56.
  • Despite signs of disinflation, Powell insists there’s still a “long road ahead” to reach the Fed’s 2% target, adding uncertainty to the market.
  • Powell cites above-trend growth and a tight labor market as potential catalysts for further hikes in the Federal Funds Rate, keeping traders on their toes.

USD/JPY rallies after remaining within familiar ranges in a choppy trading session before the US Federal Reserve Chair Jerome Powell hit the stand and delivered hawkish remarks, putting into the table additional tightening. The USD/JPY is whipsawing around 145.70-146.50 as it eyes a test of the year-to-date (YTD) high of 146.56.

Federal Reserve Chair Jerome Powell’s hawkish tone propels the USD/JPY to new YTD highs

At Jackson Hole, the Fed Chair Powell said they are prepared to continue its tightening cycle if appropriate. He emphasized that the US central bank would be data-dependent and proceed “carefully” when deciding to pause or raise borrowing costs.

Regarding inflation, he said there’s a long way to go, despite two months of good data showing the disinflationary process continues towards the US central bank goal of a 2% target. Powell added they remain unsure about the neutral rate peak and acknowledged that monetary policy faces risks on both sides, meaning over and under-tightening.

Powell emphasized that the above trend growth and tightness in the labor market would be reasons to increase the Federal Funds Rate (FFR). He added that he expects July Personal Consumption Expenditure (PCE) at 3.3%, while core PCE at 4.3%.

USD/JPY reaction

The USD/JPY oscillated at around 145.70-146.10 on Powell’s remarks but gathered direction and rose to a new year-to-date (YTD) high of 146.63 before settling at around current exchange rates. Resistance on the upside is the 147.00 figure and the November 3 high at 148.45.

It should be said the Greenback (USD) is staging a recovery, as shown by the US Dollar Index, which turned positive, sits at 104.360, gains 0.35%, underpinned by US Treasury bond yields, which are beginning to track higher.

USD/JPY 5-minute chart
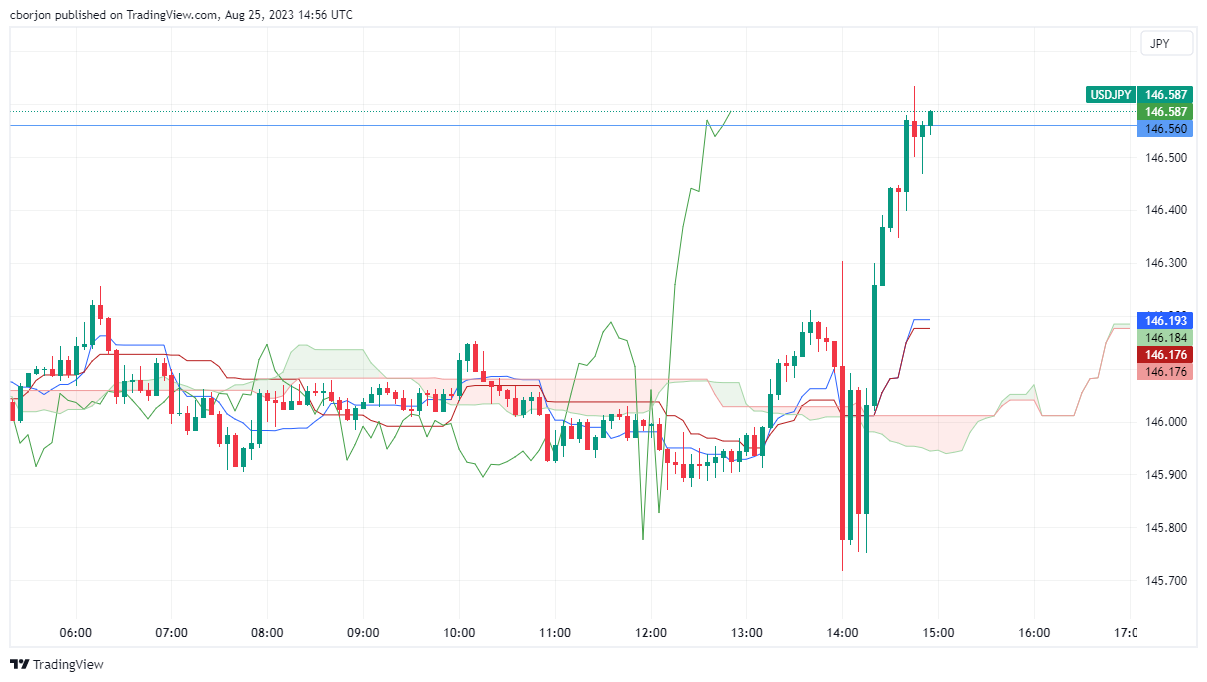
USD/JPY 5-minute chart

USD/JPY

Overview
Today last price146.57
Today Daily Change0.74
Today Daily Change %0.51
Today daily open145.83
 
Trends
Daily SMA20144.26
Daily SMA50142.77
Daily SMA100139.74
Daily SMA200136.65
 
Levels
Previous Daily High145.96
Previous Daily Low144.6
Previous Weekly High146.56
Previous Weekly Low144.65
Previous Monthly High144.91
Previous Monthly Low137.24
Daily Fibonacci 38.2%145.44
Daily Fibonacci 61.8%145.12
Daily Pivot Point S1144.97
Daily Pivot Point S2144.11
Daily Pivot Point S3143.62
Daily Pivot Point R1146.33
Daily Pivot Point R2146.82
Daily Pivot Point R3147.68

Author

Christian Borjon Valencia

Markets analyst, news editor, and trading instructor with over 14 years of experience across FX, commodities, US equity indices, and global macro markets.


More from Christian Borjon Valencia
Share:

Editor's Picks

GBP/USD breaches below 1.3500, two-day lows

GBP/USD faces renewed selling pressure, eroding the earlier advance and slipping back to the sub-1.3500 region on Wednesday. Cable’s loss of upside momentum follows the resurgence of the demand for the Greenback amid steady geopolitical tensions. Looking ahead, the British Pound is expected to remain under scrutiny in light of the release of UK GDP data on Thursday.

EUR/USD weakens to multi-day lows near 1.1520

EUR/USD makes a U-turn and trades with decent losses near 1.1520 following the closing bell on Wall Street on Wednesday. The US Dollar’s recovery post-US CPI data keeps the risk complex under pressure in a context where geopolitics takes centre stage once again. Moving forward, attention remains on US inflation with the release of Producer Prices alongside weekly Claims.

Gold clings to 100-day SMA, with upside risks intact

Gold is reverting to the $4,400 level in Asia on Thursday after facing rejection at $4,450 or fresh ten-week highs earlier in the session. Attention now turns to the US Producer Price Index data for more signs of cooling inflation, particularly after a mild US Consumer Price Index report.

Bitcoin faces thin liquidity and missing demand amid seller stress — Glassnode
Bitcoin (BTC) is showing signs of growing market exhaustion, with weakening liquidity and subdued demand leaving the market vulnerable to a sharp move, according to a Glassnode report on Wednesday. The firm stated that Bitcoin is trading between two important cost-basis levels as market activity has fallen to its lowest point since 2019.
UK GDP expected to show moderate Q2 growth

The United Kingdom’s Office for National Statistics will release the preliminary estimate of the second-quarter Gross Domestic Product on Thursday. Market analysts anticipate a 0.4% growth in the three months to June, after a modest 0.6% advance in the first quarter of 2026. Annual progress is expected at 1.1%, up from the 0.9% posted in March.

Why is Crude Oil priced for a reopening the ships haven't made?
Fourteen vessels crossed the Strait of Hormuz on Tuesday. Before the war, the count ran near 120 a day. In the sessions since the waterway was publicly declared open, Brent has drifted back to $87 and West Texas Intermediate (WTI) to $81, both a little lower again on Wednesday, with daily momentum on each unwound from the top of its range in late July to the low twenties now.















