USD/JPY retesting the 148.00 region ahead of Fed Minutes
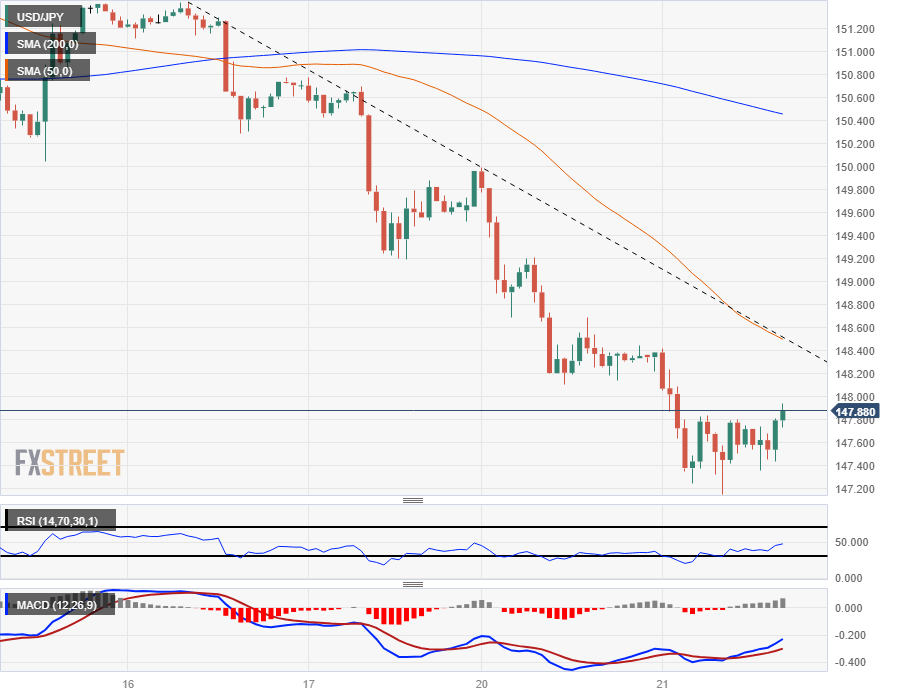
- The USD/JPY is trading steady above 147.50 after a quick dip into 147.15.
- The US Dollar is churning sideways ahead of the Fed's latest Meeting Minutes release.
- Greenback is paring away Tuesday's early declines.

The USD/JPY is pushing back into the 148.00 bid neighborhood after slipping to an intraday low of 147.15, declining from the day's opening bids near 148.40.
Market focus is tilting towards the Federal Reserve (Fed) and their latest Meeting Minutes, due at the end of the US trading session at 14:00 EST. A hawkish Fed could send jitters through the markets after last week's inflation figures pre-cooked rate cut expectations into investors' minds.
A lack of suitably dovish language from the Fed could throw markets for a loop.
US Home Sales will also complicate factors for investors as market participants lean consistently heavier into the "soft landing" narrative. US Existing Home Sales Change declined by 4.1% in October, accelerating towards the downside from last month's -2.2%, which was also revised downwards from 2.0%.
October's Existing Home Sales hit 3.7M, dipping past the forecast 3.9M forecast and shedding volume from September's 3.96M. The figure represents the lowest amount of already-built homes changing hands since 2010.
Japanese Yen price today
The table below shows the percentage change of Japanese Yen (JPY) against listed major currencies today. Japanese Yen was the strongest against the Euro.
| USD | EUR | GBP | CAD | AUD | JPY | NZD | CHF | |
| USD | 0.18% | -0.21% | -0.24% | -0.07% | -0.32% | -0.37% | -0.17% | |
| EUR | -0.17% | -0.37% | -0.40% | -0.27% | -0.50% | -0.55% | -0.34% | |
| GBP | 0.21% | 0.39% | -0.03% | 0.12% | -0.11% | -0.16% | 0.04% | |
| CAD | 0.24% | 0.42% | 0.03% | 0.15% | -0.10% | -0.13% | 0.06% | |
| AUD | 0.08% | 0.28% | -0.11% | -0.14% | -0.23% | -0.28% | -0.05% | |
| JPY | 0.31% | 0.50% | 0.11% | 0.09% | 0.21% | -0.09% | 0.14% | |
| NZD | 0.37% | 0.55% | 0.17% | 0.13% | 0.28% | 0.04% | 0.20% | |
| CHF | 0.16% | 0.35% | -0.04% | -0.07% | 0.08% | -0.15% | -0.20% |
The heat map shows percentage changes of major currencies against each other. The base currency is picked from the left column, while the quote currency is picked from the top row. For example, if you pick the Euro from the left column and move along the horizontal line to the Japanese Yen, the percentage change displayed in the box will represent EUR (base)/JPY (quote).
USD/JPY Technical Outlook
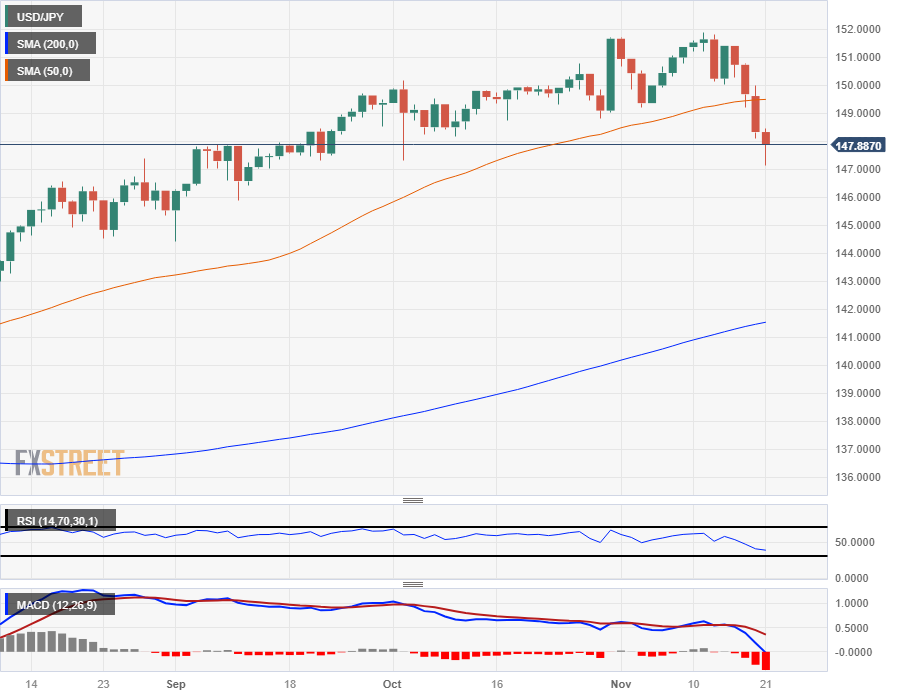
The USD/JPY has seen steady declines from last week's highs near 151.91, closing bearish for four of the last five trading sessions, and is set to close for a fourth straight red candle if Tuesday closes below 148.33.
This week's decline sees the pair trading to the south side of the 50-day Simple Moving Average (SMA) near 149.50, and long-term technical support will be waiting to meet bears at the 200-day SMA near 141.50.
USD/JPY Hourly Chart
USD/JPY Daily Chart
Author

Joshua Gibson
FXStreet
Joshua joins the FXStreet team as an Economics and Finance double major from Vancouver Island University with twelve years' experience as an independent trader focusing on technical analysis.
















