USD/JPY Price Analysis: Yen recovery stalls above 139.00, bull flag in the spotlight


  • USD/JPY picks up bids to snap three-day downtrend, stays within bullish chart formation.
  • RSI rebound adds strength to the upside bias but bearish MACD signals, 139.80 hurdle prod Yen pair bulls.
  • Multiple supports, recently upbeat market sentiment challenge Yen buyers.

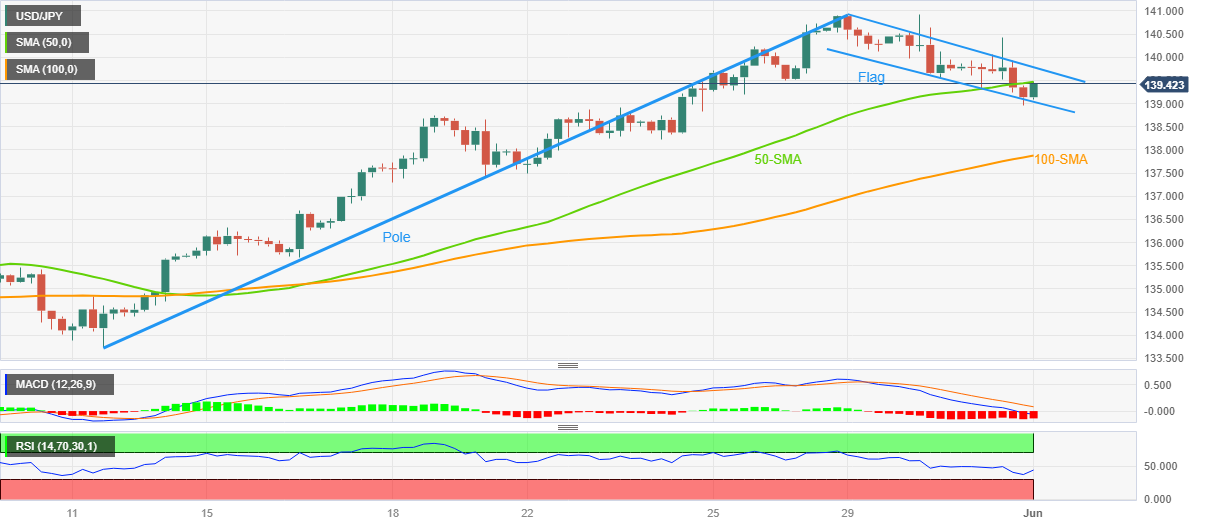
USD/JPY picks up bids to refresh its intraday high near 139.50 as it prints the first daily gains in four during early Thursday. In doing so, the Yen pair recovers from the bottom line of a short-term bull flag formation.

That said, the RSI (14) line’s rebound from the below-50 region seems to underpin the USD/JPY pair’s latest recovery moves within the flag. However, the 50-SMA hurdle of near 139.50 joins the bearish MACD signals to challenge the bulls.

In a case where the USD/JPY pair manages to cross the 139.50 hurdle, the stated flag’s top-line surrounding 139.80 will be eyed closely as a break of which will confirm the bullish chart formation suggesting a theoretical target of around 146.50.

However, the 140.00 round figure and the yearly high marked on Monday near 140.45 can challenge the USD/JPY buyers before giving them control.

Also acting as an upside filter below 146.50 is the November 2022 high of near 142.25 and the last September’s peak of 145.90.

On the flip side, a clear break of the 139.00 immediate support will defy the bullish chart formation and can drag the USD/JPY price towards the mid-May swing high of near 138.75.

Following that, the 100-SMA level of near 137.85 may act as the last defense of the USD/JPY buyers.

USD/JPY: Four-hour chart

Trend: Further upside expected

Additional important levels

Overview
Today last price 139.39
Today Daily Change 0.05
Today Daily Change % 0.04%
Today daily open 139.34
 
Trends
Daily SMA20 137.38
Daily SMA50 134.97
Daily SMA100 133.74
Daily SMA200 137.27
 
Levels
Previous Daily High 140.43
Previous Daily Low 139.24
Previous Weekly High 140.72
Previous Weekly Low 137.49
Previous Monthly High 140.93
Previous Monthly Low 133.5
Daily Fibonacci 38.2% 139.69
Daily Fibonacci 61.8% 139.97
Daily Pivot Point S1 138.91
Daily Pivot Point S2 138.48
Daily Pivot Point S3 137.72
Daily Pivot Point R1 140.1
Daily Pivot Point R2 140.86
Daily Pivot Point R3 141.29


Share: Feed news

Information on these pages contains forward-looking statements that involve risks and uncertainties. Markets and instruments profiled on this page are for informational purposes only and should not in any way come across as a recommendation to buy or sell in these assets. You should do your own thorough research before making any investment decisions. FXStreet does not in any way guarantee that this information is free from mistakes, errors, or material misstatements. It also does not guarantee that this information is of a timely nature. Investing in Open Markets involves a great deal of risk, including the loss of all or a portion of your investment, as well as emotional distress. All risks, losses and costs associated with investing, including total loss of principal, are your responsibility. The views and opinions expressed in this article are those of the authors and do not necessarily reflect the official policy or position of FXStreet nor its advertisers. The author will not be held responsible for information that is found at the end of links posted on this page.

If not otherwise explicitly mentioned in the body of the article, at the time of writing, the author has no position in any stock mentioned in this article and no business relationship with any company mentioned. The author has not received compensation for writing this article, other than from FXStreet.

FXStreet and the author do not provide personalized recommendations. The author makes no representations as to the accuracy, completeness, or suitability of this information. FXStreet and the author will not be liable for any errors, omissions or any losses, injuries or damages arising from this information and its display or use. Errors and omissions excepted.

The author and FXStreet are not registered investment advisors and nothing in this article is intended to be investment advice.

Recommended content


Recommended content

Editors’ Picks

AUD/USD: Gains appear capped near 0.6580

AUD/USD: Gains appear capped near 0.6580

AUD/USD made a sharp U-turn on Tuesday, reversing six consecutive sessions of gains and tumbling to multi-day lows near 0.6480 on the back of the robust bounce in the Greenback.

AUD/USD News

EUR/USD looks depressed ahead of FOMC

EUR/USD looks depressed ahead of FOMC

EUR/USD followed the sour mood prevailing in the broader risk complex and plummeted to multi-session lows in the vicinity of 1.0670 in response to the data-driven rebound in the US Dollar prior to the Fed’s interest rate decision.

EUR/USD News

Gold stable below $2,300 despite mounting fears

Gold stable below $2,300 despite mounting fears

Gold stays under selling pressure and confronts the $2,300 region on Tuesday against the backdrop of the resumption of the bullish trend in the Greenback and the decent bounce in US yields prior to the interest rate decision by the Fed on Wednesday.

Gold News

Bitcoin price tests $60K range as Coinbase advances toward instant, low-cost BTC transfers

Bitcoin price tests $60K range as Coinbase advances toward instant, low-cost BTC transfers

BTC bulls need to hold here on the daily time frame, lest we see $52K range tested. Bitcoin (BTC) price slid lower on Tuesday during the opening hours of the New York session, dipping its toes into a crucial chart area.

Read more

Federal Reserve meeting preview: The stock market expects the worst

Federal Reserve meeting preview: The stock market expects the worst

US stocks are a sea of red on Tuesday as a mixture of fundamental data and jitters ahead of the Fed meeting knock risk sentiment. The economic backdrop to this meeting is not ideal for stock market bulls. 

Read more

Forex MAJORS

Cryptocurrencies

Signatures