|

USD/JPY Price Analysis: Yen pares BoJ Minutes-led gains below 135.00 as 50-SMA prods bulls

  • USD/JPY holds lower ground near intraday low after reversing from 50-SMA.
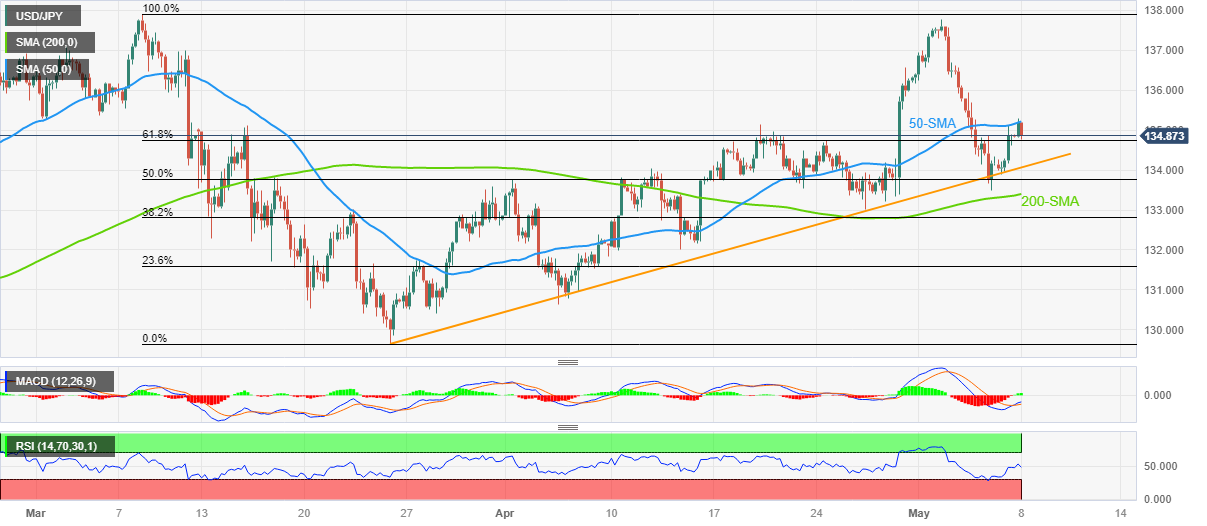
  • 61.8% Fibonacci retracement level restricts immediate downside ahead of six-week-old support line, 200-SMA.
  • Multiple hurdles toward the north stand tall to challenge Yen pair buyers past 50-SMA, oscillators favor further upside.

USD/JPY bulls struggle to keep the reins after snapping three-day downtrend the previous day. That said, the Yen pair retreats to 134.90 during early Monday, following an initial run-up to prod the 50-SMA hurdle, favored by the March month’s Monetary Policy Meeting Minutes from the Bank of Japan (BoJ).

Also read: BoJ Minutes: Several members said must be vigilant to risk inflation may accelerate more than expected

Even so, the Yen pair remains above the 61.8% Fibonacci retracement level of its March month downside, near 134.75, which in turn keeps the buyers hopeful. Adding strength to the upside bias are the bullish MACD signals and the near-50 RSI (14) line suggesting a continuation of the latest rebound from an upward-sloping support line from late March.

With this, the USD/JPY bulls appear well-set to cross the 50-SMA hurdle surrounding 135.25. However, lows marked during early March around 135.30-40 can challenge the pair’s further upside.

Also acting as the upside hurdle are the multiple levels around the 137.00 round figure, as well as double tops marked near 137.80-90. Furthermore, the 138.00 threshold acts as the last defense of the USD/JPY bears.

On the contrary, a downside break of the aforementioned support line, close to the 134.00 round figure, isn’t an open welcome to the Yen pair bears as the 200-SMA level of 133.40 can act as an additional filter to the south.

USD/JPY: Four-hour chart

Trend: Further upside expected

Additional important levels

Overview
Today last price134.84
Today Daily Change0.01
Today Daily Change %0.01%
Today daily open134.83
 
Trends
Daily SMA20134.41
Daily SMA50133.88
Daily SMA100132.84
Daily SMA200136.99
 
Levels
Previous Daily High135.12
Previous Daily Low133.88
Previous Weekly High137.78
Previous Weekly Low133.5
Previous Monthly High136.56
Previous Monthly Low130.63
Daily Fibonacci 38.2%134.65
Daily Fibonacci 61.8%134.36
Daily Pivot Point S1134.1
Daily Pivot Point S2133.37
Daily Pivot Point S3132.86
Daily Pivot Point R1135.34
Daily Pivot Point R2135.85
Daily Pivot Point R3136.58

Author

Anil Panchal

Anil Panchal

FXStreet

Anil Panchal has nearly 15 years of experience in tracking financial markets. With a keen interest in macroeconomics, Anil aptly tracks global news/updates and stays well-informed about the global financial moves and their implications.

More from Anil Panchal
Share:

Markets move fast. We move first.

Orange Juice Newsletter brings you expert driven insights - not headlines. Every day on your inbox.

By subscribing you agree to our Terms and conditions.

Editor's Picks

EUR/USD bounces toward 1.1750 as US Dollar loses strength

EUR/USD returned to the 1.1750 price zone in the American session on Friday, despite falling Wall Street, which indicates risk aversion. Trading conditions remain thin following the New Year holiday and ahead of the weekend, with the focus shifting to US employment and European data scheduled for next week.

GBP/USD nears 1.3500, holds within familiar levels

After testing 1.3400 on the last day of 2025, GBP/USD managed to stage a rebound. Nevertheless, the pair finds it difficult to gather momentum and trades with modest intraday gains at around 1.3490 as market participants remain in holiday mood.

Gold trims intraday gains, approaches $4,300

Gold retreated sharply from the $4,400  area and trades flat for the day in the $4,320 price zone. Choppy trading conditions exacerbated the intraday decline, although XAU/USD bearish case is out of the picture, considering growing expectations for a dovish Fed and persistent geopolitical tensions.

Cardano gains early New Year momentum, bulls target falling wedge breakout

Cardano kicks off the New Year on a positive note and is extending gains, trading above $0.36 at the time of writing on Friday. Improving on-chain and derivatives data point to growing bullish interest, while the technical outlook keeps an upside breakout in focus.

Economic outlook 2026-2027 in advanced countries: Solidity test

After a year marked by global economic resilience and ending on a note of optimism, 2026 looks promising and could be a year of solid economic performance. In our baseline scenario, we expect most of the supportive factors at work in 2025 to continue to play a role in 2026.

Crypto market outlook for 2026

Year 2025 was volatile, as crypto often is.  Among positive catalysts were favourable regulatory changes in the U.S., rise of Digital Asset Treasuries (DAT), adoption of AI and tokenization of Real-World-Assets (RWA).