USD/JPY Price Analysis: Slips from bull’s radar, symmetrical triangle in focus


  • USD/JPY remains depressed inside a fortnight-old triangle after reversing from one-week high.
  • Convergence of 100-EMA, descending trend line from mid-December guards immediate upside.
  • Sluggish RSI, multiple hurdles to the north challenge buyers.
  • 200-EMA acts as the last defense for bears.

USD/JPY stays pressured around the 130.00 round figure, following a pullback from the one-week high, as the Yen pair traders remain cautious ahead of the Federal Reserve (Fed) monetary policy outcome on Wednesday.

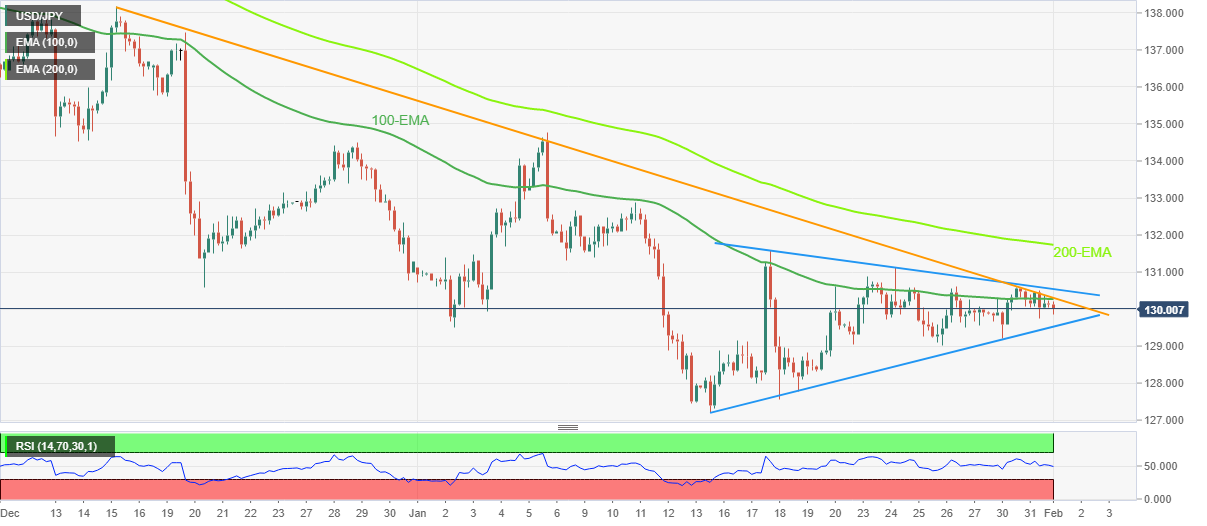
Technically, the two-week-long symmetrical triangle restricts the immediate USD/JPY moves.

That said, the pair’s latest weakness could be linked to the failure to cross the downward-sloping resistance line from December 15 and the 100-bar Exponential Moving Average (EMA), around 130.30 by the press time. Also challenging the USD/JPY buyers could be the sluggish RSI (14) line.

It’s worth noting, however, that the pair sellers need to conquer the stated triangle’s support line, around 129.50 at the latest, to retake control. Following that, a slump toward the previous monthly low of 127.21 can’t be ruled out.

Alternatively, the 130.30 resistance confluence restricts immediate USD/JPY upside ahead of the aforementioned triangle’s top line, close to 130.55 as we write.

Should the Yen pair remains firmer past 130.55, the 200-EMA level surrounding 131.75 will act as the last defense of the bears, a break of which may open doors for the quote’s run-up towards the previous monthly high near 134.80.

USD/JPY: Four-hour chart

Trend: Pullback expected

Additional important levels

Overview
Today last price 130.07
Today Daily Change -0.07
Today Daily Change % -0.05%
Today daily open 130.14
 
Trends
Daily SMA20 130.33
Daily SMA50 133.38
Daily SMA100 139.19
Daily SMA200 136.79
 
Levels
Previous Daily High 130.53
Previous Daily Low 129.74
Previous Weekly High 131.12
Previous Weekly Low 129.02
Previous Monthly High 134.78
Previous Monthly Low 127.22
Daily Fibonacci 38.2% 130.04
Daily Fibonacci 61.8% 130.23
Daily Pivot Point S1 129.74
Daily Pivot Point S2 129.35
Daily Pivot Point S3 128.95
Daily Pivot Point R1 130.53
Daily Pivot Point R2 130.93
Daily Pivot Point R3 131.32


Share: Feed news

Information on these pages contains forward-looking statements that involve risks and uncertainties. Markets and instruments profiled on this page are for informational purposes only and should not in any way come across as a recommendation to buy or sell in these assets. You should do your own thorough research before making any investment decisions. FXStreet does not in any way guarantee that this information is free from mistakes, errors, or material misstatements. It also does not guarantee that this information is of a timely nature. Investing in Open Markets involves a great deal of risk, including the loss of all or a portion of your investment, as well as emotional distress. All risks, losses and costs associated with investing, including total loss of principal, are your responsibility. The views and opinions expressed in this article are those of the authors and do not necessarily reflect the official policy or position of FXStreet nor its advertisers. The author will not be held responsible for information that is found at the end of links posted on this page.

If not otherwise explicitly mentioned in the body of the article, at the time of writing, the author has no position in any stock mentioned in this article and no business relationship with any company mentioned. The author has not received compensation for writing this article, other than from FXStreet.

FXStreet and the author do not provide personalized recommendations. The author makes no representations as to the accuracy, completeness, or suitability of this information. FXStreet and the author will not be liable for any errors, omissions or any losses, injuries or damages arising from this information and its display or use. Errors and omissions excepted.

The author and FXStreet are not registered investment advisors and nothing in this article is intended to be investment advice.

Recommended content


Recommended content

Editors’ Picks

EUR/USD edges lower toward 1.0700 post-US PCE

EUR/USD edges lower toward 1.0700 post-US PCE

EUR/USD stays under modest bearish pressure but manages to hold above 1.0700 in the American session on Friday. The US Dollar (USD) gathers strength against its rivals after the stronger-than-forecast PCE inflation data, not allowing the pair to gain traction.

EUR/USD News

GBP/USD retreats to 1.2500 on renewed USD strength

GBP/USD retreats to 1.2500 on renewed USD strength

GBP/USD lost its traction and turned negative on the day near 1.2500. Following the stronger-than-expected PCE inflation readings from the US, the USD stays resilient and makes it difficult for the pair to gather recovery momentum.

GBP/USD News

Gold struggles to hold above $2,350 following US inflation

Gold struggles to hold above $2,350 following US inflation

Gold turned south and declined toward $2,340, erasing a large portion of its daily gains, as the USD benefited from PCE inflation data. The benchmark 10-year US yield, however, stays in negative territory and helps XAU/USD limit its losses. 

Gold News

Bitcoin Weekly Forecast: BTC’s next breakout could propel it to $80,000 Premium

Bitcoin Weekly Forecast: BTC’s next breakout could propel it to $80,000

Bitcoin’s recent price consolidation could be nearing its end as technical indicators and on-chain metrics suggest a potential upward breakout. However, this move would not be straightforward and could punish impatient investors. 

Read more

Week ahead – Hawkish risk as Fed and NFP on tap, Eurozone data eyed too

Week ahead – Hawkish risk as Fed and NFP on tap, Eurozone data eyed too

Fed meets on Wednesday as US inflation stays elevated. Will Friday’s jobs report bring relief or more angst for the markets? Eurozone flash GDP and CPI numbers in focus for the Euro.

Read more

Forex MAJORS

Cryptocurrencies

Signatures