USD/JPY Price Analysis: Rising wedge, overbought RSI probe recovery below 133.00


  • USD/JPY picks up bids to pare BOJ-inflicted losses during three-day winning streak.
  • Bearish chart formation, overbought RSI conditions challenge further upside.
  • Sellers need validation from 50-HMA before targeting fresh multi-month low.

USD/JPY grinds near intraday high surrounding 132.80 as it consolidates the Bank of Japan (BOJ) induces losses during the three-day recovery amid early Friday.

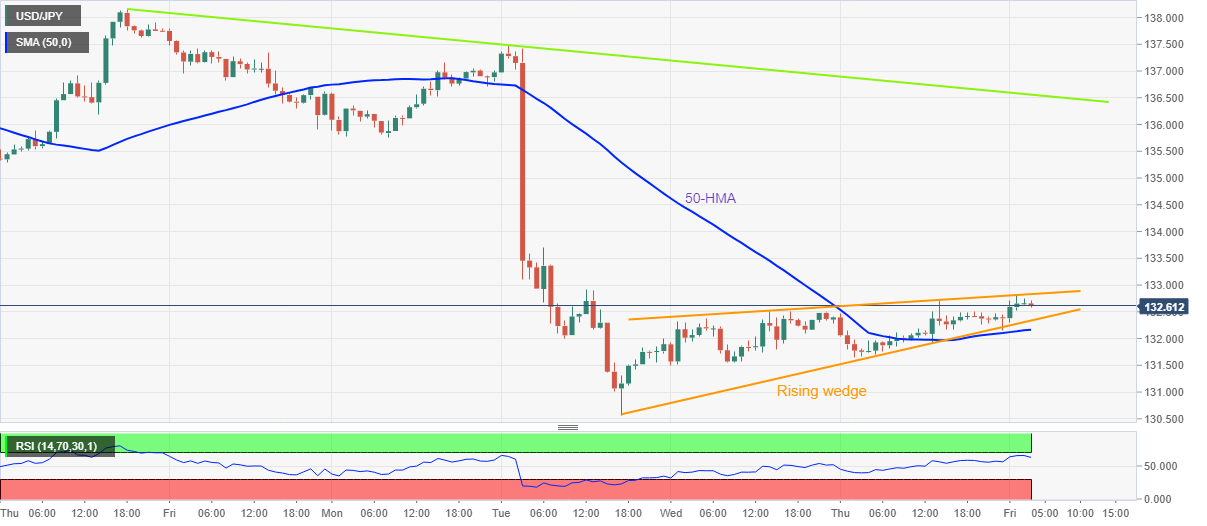
In doing so, the Yen pair seesaws near the upper line of a short-term rising wedge bearish chart formation. Also keeping the sellers hopeful are the overbought conditions of the Relative Strength Index (RSI), located at 14.

However, the 50-Hour Moving Average (HMA) near 132.15 acts as an extra downside filter, in addition to the stated wedge’s support of around 132.35, to challenge the USD/JPY bears.

In a case where the USD/JPY price breaks the 132.15 HMA support, the odds of witnessing a slump toward the recently flashed four-month low near 130.55 can’t be ruled out.

Following that, the theoretical target of the rising wedge, near the 130.00 psychological magnet, will be in focus.

Meanwhile, the aforementioned wedge’s top line restricts immediate USD/JPY advances near 132.85, a break of which could quickly recall the 133.00 round figure to the chart.

Though, Tuesday’s swing high near 133.70, marked during the early European session, becomes crucial for the USD/JPY bulls to watch afterward.

Overall, USD/JPY appears to fade the recovery momentum and hence bears should lookout for entries.

USD/JPY: Hourly chart

Trend: Pullback expected

Additional important levels

Overview
Today last price 132.66
Today Daily Change 0.29
Today Daily Change % 0.22%
Today daily open 132.37
 
Trends
Daily SMA20 136.23
Daily SMA50 141.49
Daily SMA100 141.17
Daily SMA200 135.86
 
Levels
Previous Daily High 132.72
Previous Daily Low 131.64
Previous Weekly High 138.18
Previous Weekly Low 134.52
Previous Monthly High 148.82
Previous Monthly Low 137.5
Daily Fibonacci 38.2% 132.31
Daily Fibonacci 61.8% 132.05
Daily Pivot Point S1 131.77
Daily Pivot Point S2 131.17
Daily Pivot Point S3 130.7
Daily Pivot Point R1 132.85
Daily Pivot Point R2 133.32
Daily Pivot Point R3 133.92


Share: Feed news

Information on these pages contains forward-looking statements that involve risks and uncertainties. Markets and instruments profiled on this page are for informational purposes only and should not in any way come across as a recommendation to buy or sell in these assets. You should do your own thorough research before making any investment decisions. FXStreet does not in any way guarantee that this information is free from mistakes, errors, or material misstatements. It also does not guarantee that this information is of a timely nature. Investing in Open Markets involves a great deal of risk, including the loss of all or a portion of your investment, as well as emotional distress. All risks, losses and costs associated with investing, including total loss of principal, are your responsibility. The views and opinions expressed in this article are those of the authors and do not necessarily reflect the official policy or position of FXStreet nor its advertisers. The author will not be held responsible for information that is found at the end of links posted on this page.

If not otherwise explicitly mentioned in the body of the article, at the time of writing, the author has no position in any stock mentioned in this article and no business relationship with any company mentioned. The author has not received compensation for writing this article, other than from FXStreet.

FXStreet and the author do not provide personalized recommendations. The author makes no representations as to the accuracy, completeness, or suitability of this information. FXStreet and the author will not be liable for any errors, omissions or any losses, injuries or damages arising from this information and its display or use. Errors and omissions excepted.

The author and FXStreet are not registered investment advisors and nothing in this article is intended to be investment advice.

Recommended content


Recommended content

Editors’ Picks

EUR/USD edges lower toward 1.0700 post-US PCE

EUR/USD edges lower toward 1.0700 post-US PCE

EUR/USD stays under modest bearish pressure but manages to hold above 1.0700 in the American session on Friday. The US Dollar (USD) gathers strength against its rivals after the stronger-than-forecast PCE inflation data, not allowing the pair to gain traction.

EUR/USD News

GBP/USD retreats to 1.2500 on renewed USD strength

GBP/USD retreats to 1.2500 on renewed USD strength

GBP/USD lost its traction and turned negative on the day near 1.2500. Following the stronger-than-expected PCE inflation readings from the US, the USD stays resilient and makes it difficult for the pair to gather recovery momentum.

GBP/USD News

Gold struggles to hold above $2,350 following US inflation

Gold struggles to hold above $2,350 following US inflation

Gold turned south and declined toward $2,340, erasing a large portion of its daily gains, as the USD benefited from PCE inflation data. The benchmark 10-year US yield, however, stays in negative territory and helps XAU/USD limit its losses. 

Gold News

Bitcoin Weekly Forecast: BTC’s next breakout could propel it to $80,000 Premium

Bitcoin Weekly Forecast: BTC’s next breakout could propel it to $80,000

Bitcoin’s recent price consolidation could be nearing its end as technical indicators and on-chain metrics suggest a potential upward breakout. However, this move would not be straightforward and could punish impatient investors. 

Read more

Week ahead – Hawkish risk as Fed and NFP on tap, Eurozone data eyed too

Week ahead – Hawkish risk as Fed and NFP on tap, Eurozone data eyed too

Fed meets on Wednesday as US inflation stays elevated. Will Friday’s jobs report bring relief or more angst for the markets? Eurozone flash GDP and CPI numbers in focus for the Euro.

Read more

Forex MAJORS

Cryptocurrencies

Signatures