USD/JPY Price Analysis: Retreats from monthly resistance around 137.00


  • USD/JPY eases from one-week high, fades bounce off 200-DMA.
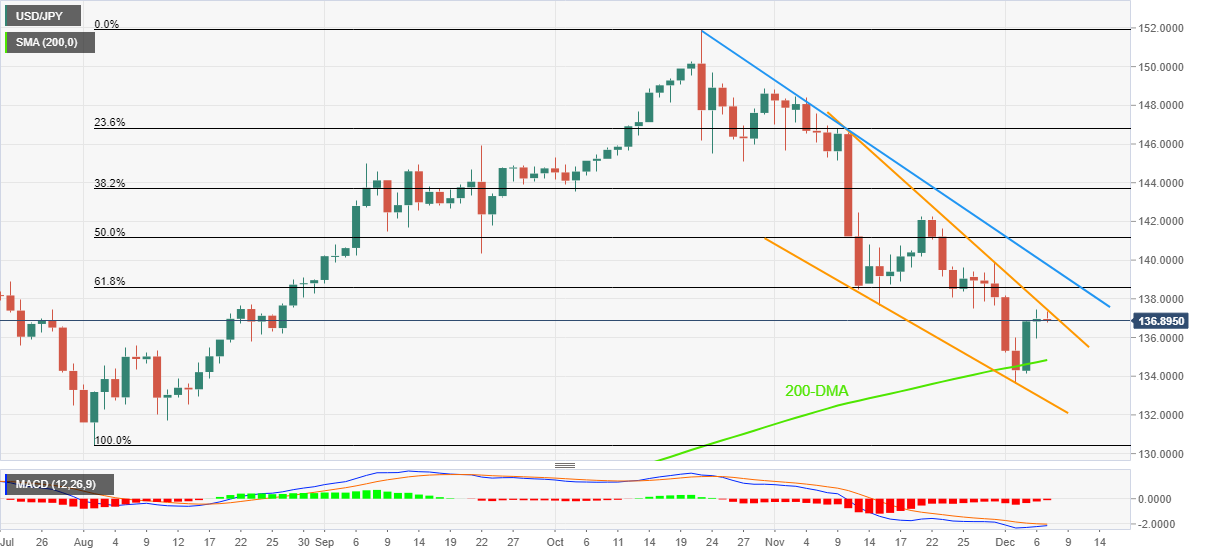
  • Impending bull cross on MACD, falling wedge formation keeps buyers hopeful.
  • Sellers have a bumpy road to travel unless breaking August month’s low.

USD/JPY takes offers to refresh intraday low around 136.90, extending pullback from a one-week high during early Wednesday.

In doing so, the Yen pair reverses from a downward-sloping resistance line from early November while fading the weak-start bounce off the 200-DMA.

However, the looming bull cross on the MACD indicator joins the falling wedge bullish chart formation to challenge the USD/JPY sellers.

That said, the 200-DMA level surrounding 134.70 restrict the short-term downside of the pair ahead of the lower line of the stated wedge, near 132.70.

Following that, lows marked in August month around 131.75 and 130.40 will precede the 130.00 psychological magnet to challenge the USD/JPY pair’s further downside.

It’s worth noting, however, that the Yen pair’s sustained trading below 130.00 could make it vulnerable to slump toward May’s low near 126.35.

Meanwhile, recovery moves need to provide a successful break of the stated wedge’s upper line, near 137.45 by the press time.

Even so, a downward-sloping resistance line from late October could challenge the USD/JPY bulls around 139.80.

Following that, the 140.00 round figure and the late November swing high near 142.25 may act as buffers during the run-up towards the theoretical target of the falling wedge, close to 151.40.

USD/JPY: Daily chart

Trend: Further upside expected

Additional important levels

Overview
Today last price 136.95
Today Daily Change -0.01
Today Daily Change % -0.01%
Today daily open 136.96
 
Trends
Daily SMA20 139.24
Daily SMA50 143.82
Daily SMA100 141.11
Daily SMA200 134.73
 
Levels
Previous Daily High 137.43
Previous Daily Low 135.96
Previous Weekly High 139.9
Previous Weekly Low 133.62
Previous Monthly High 148.82
Previous Monthly Low 137.5
Daily Fibonacci 38.2% 136.87
Daily Fibonacci 61.8% 136.52
Daily Pivot Point S1 136.14
Daily Pivot Point S2 135.32
Daily Pivot Point S3 134.67
Daily Pivot Point R1 137.6
Daily Pivot Point R2 138.25
Daily Pivot Point R3 139.07


Share: Feed news

Information on these pages contains forward-looking statements that involve risks and uncertainties. Markets and instruments profiled on this page are for informational purposes only and should not in any way come across as a recommendation to buy or sell in these assets. You should do your own thorough research before making any investment decisions. FXStreet does not in any way guarantee that this information is free from mistakes, errors, or material misstatements. It also does not guarantee that this information is of a timely nature. Investing in Open Markets involves a great deal of risk, including the loss of all or a portion of your investment, as well as emotional distress. All risks, losses and costs associated with investing, including total loss of principal, are your responsibility. The views and opinions expressed in this article are those of the authors and do not necessarily reflect the official policy or position of FXStreet nor its advertisers. The author will not be held responsible for information that is found at the end of links posted on this page.

If not otherwise explicitly mentioned in the body of the article, at the time of writing, the author has no position in any stock mentioned in this article and no business relationship with any company mentioned. The author has not received compensation for writing this article, other than from FXStreet.

FXStreet and the author do not provide personalized recommendations. The author makes no representations as to the accuracy, completeness, or suitability of this information. FXStreet and the author will not be liable for any errors, omissions or any losses, injuries or damages arising from this information and its display or use. Errors and omissions excepted.

The author and FXStreet are not registered investment advisors and nothing in this article is intended to be investment advice.

Recommended content


Recommended content

Editors’ Picks

EUR/USD edges lower toward 1.0700 post-US PCE

EUR/USD edges lower toward 1.0700 post-US PCE

EUR/USD stays under modest bearish pressure but manages to hold above 1.0700 in the American session on Friday. The US Dollar (USD) gathers strength against its rivals after the stronger-than-forecast PCE inflation data, not allowing the pair to gain traction.

EUR/USD News

GBP/USD retreats to 1.2500 on renewed USD strength

GBP/USD retreats to 1.2500 on renewed USD strength

GBP/USD lost its traction and turned negative on the day near 1.2500. Following the stronger-than-expected PCE inflation readings from the US, the USD stays resilient and makes it difficult for the pair to gather recovery momentum.

GBP/USD News

Gold struggles to hold above $2,350 following US inflation

Gold struggles to hold above $2,350 following US inflation

Gold turned south and declined toward $2,340, erasing a large portion of its daily gains, as the USD benefited from PCE inflation data. The benchmark 10-year US yield, however, stays in negative territory and helps XAU/USD limit its losses. 

Gold News

Bitcoin Weekly Forecast: BTC’s next breakout could propel it to $80,000 Premium

Bitcoin Weekly Forecast: BTC’s next breakout could propel it to $80,000

Bitcoin’s recent price consolidation could be nearing its end as technical indicators and on-chain metrics suggest a potential upward breakout. However, this move would not be straightforward and could punish impatient investors. 

Read more

Week ahead – Hawkish risk as Fed and NFP on tap, Eurozone data eyed too

Week ahead – Hawkish risk as Fed and NFP on tap, Eurozone data eyed too

Fed meets on Wednesday as US inflation stays elevated. Will Friday’s jobs report bring relief or more angst for the markets? Eurozone flash GDP and CPI numbers in focus for the Euro.

Read more

Forex MAJORS

Cryptocurrencies

Signatures