|

USD/JPY Price Analysis: Renews three-week high but 50-DMA probes bulls

  • USD/JPY grinds higher around three-week top during two-day uptrend.
  • Successful break of 130.00 support-confluence join firmer oscillators to favor bulls.
  • 50-DMA challenges immediate upside ahead of January’s peak.

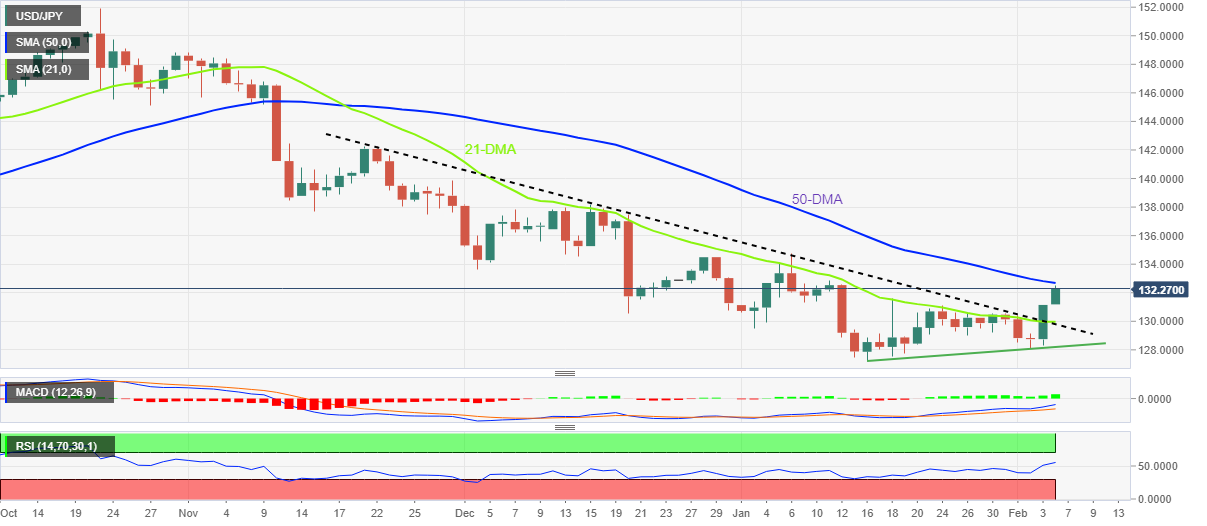
USD/JPY remains firmer as buyers keep the reins at the highest levels in three weeks during early Monday. In doing so, the Yen pair also justifies the previous day’s upside break of the key 130.00 hurdle, now support, while portraying a two-day uptrend. That said, the Yen pair trades around 132.30 by the press time.

In addition to the upside break of the previous resistance line from late November 2022 and the 21-DMA, bullish MACD signals and upbeat RSI (14), not overbought, also keep the USD/JPY buyers hopeful.

However, the 50-DMA hurdle surrounding 132.70 presently challenges the USD/JPY bulls. Also acting as an upside filter is the previous monthly peak of around 134.80.

It should be noted that a clear upside break of 134.80 could convince buyers to retake control and reverse the downtrend from early November.

On the flip side, the aforementioned resistance-turned-support confluence near the 130.00 psychological magnet puts a floor under the USD/JPY prices.

Following that, an ascending trend line from mid-January will challenge the USD/JPY sellers around 128.20.

If at all the USD/JPY bears manage to conquer the 128.20 support bottom surrounding 127.20 and May 2022 low near 126.35 could probe them before highlighting the 120.00 round figure.

Overall, USD/JPY is likely to extend the latest recovery but a clear upside break of the 50-DMA becomes necessary for the buyer’s welcome.

USD/JPY: Daily chart
Trend: Further upside expected

Additional important levels

Overview
Today last price132.26
Today Daily Change1.11
Today Daily Change %0.85%
Today daily open131.15
 
Trends
Daily SMA20129.86
Daily SMA50132.81
Daily SMA100138.79
Daily SMA200136.79
 
Levels
Previous Daily High131.2
Previous Daily Low128.33
Previous Weekly High131.2
Previous Weekly Low128.08
Previous Monthly High134.78
Previous Monthly Low127.22
Daily Fibonacci 38.2%130.1
Daily Fibonacci 61.8%129.42
Daily Pivot Point S1129.25
Daily Pivot Point S2127.35
Daily Pivot Point S3126.38
Daily Pivot Point R1132.12
Daily Pivot Point R2133.09
Daily Pivot Point R3134.99

Author

Anil Panchal

Anil Panchal

FXStreet

Anil Panchal has nearly 15 years of experience in tracking financial markets. With a keen interest in macroeconomics, Anil aptly tracks global news/updates and stays well-informed about the global financial moves and their implications.


More from Anil Panchal
Share:

Editor's Picks

GBP/USD bounces off four-day lows, still below 1.3500

GBP/USD sticks to the bearish tone on Thursday, coming down to the 1.3480 region in the latter part of the NA session. In the meantime, Cable’s weakness comes as investors continue to assess mixed UK data, poor US results, and the persistent uncertainty surrounding the US-Iran conflict.

EUR/USD looks apathetic around 1.1530

EUR/USD reverses Wednesday’s downtick and trades with modest gains in the 1.1530 region following the end of the NA session on Thursday. The pair’s tepid advance comes on the back of the absence of clear direction in the US Dollar despite tensions from the Middle East appear far from alleviated. Later on Friday, investors are expected to monitor the the releases of another revision of GDP figures in the Euroland, US Retail Sales and the preliminary U-Mich gauge.

Gold loses the grip, recedes toward $4,350

Gold extends its intraday pullback on Thursday, retesting the $4,350 zone per troy ounce, or three-day troughs. Meanwhile, the yellow metal continues to monitor developments from the Middle East as well as bets surrounding the potential Fed’s rate path.

Ethereum Price Forecast: Fidelity plans to add staking to ETH ETF amid yield debate
Asset manager Fidelity has filed with the US Securities and Exchange Commission (SEC) to permit staking in its Ethereum (ETH) exchange-traded fund (ETF), the Fidelity Ethereum Fund (FETH), which holds over $898 million in net assets.
Why credit markets aren’t pricing $570B of AI debt

Forecasts put global artificial intelligence related debt issuance near $570 billion this year, with roughly $236 billion of it priced by the end of May at four times the prior year's pace. Data centre securitisation alone has gone from about $4 billion a year through 2022 to roughly $10 billion in each of 2023 and 2024, and then $27 billion in 2025.

Why is Crude Oil priced for a reopening the ships haven't made?
Fourteen vessels crossed the Strait of Hormuz on Tuesday. Before the war, the count ran near 120 a day. In the sessions since the waterway was publicly declared open, Brent has drifted back to $87 and West Texas Intermediate (WTI) to $81, both a little lower again on Wednesday, with daily momentum on each unwound from the top of its range in late July to the low twenties now.















