USD/JPY Price Analysis: Record minimal losses but clings around 127.70s on falling US T-bond yields


Share:
  • The USD/JPY loses for the second straight week, 1.10%.
  • The greenback remained strong in the session, boosted by a dampened market mood, as US equities reached fresh 52-week lows.
  • USD/JPY Price Forecast: Range-bound lacking a catalyst that can rock the boat.

The USD/JPY continues sliding for the third straight day, though the downtrend capped at April’s 27 daily low at 126.94, keeping the major’s uptrend intact amidst a downbeat market mood on the last trading day of the week, as the Wall Street close looms. At 127.82, the USD/JPY records minimal gains of 0.04%.

US equities are plunging between 1.51% and 2.49%. The Dow Jones and the Nasdaq reached a 52-week low, despite efforts from the People Bank of China (PBoC) to stimulate the Chinese economy when it cut rates in the 5-year Loan Prime Rate (LPR) by 0.15%. Although the decision was cheered by investors in the Asian and European sessions, it was ignored in the New York session, as options expiring tied to equities and ETFs increased volatility.

In the meantime, the US Dollar Index, a measurement of the greenback’s value against its peers, recovers some 0.23% in the day and sits at 103.102. Contrarily, US Treasury yields, led by the 10-year benchmark note, is down from a 3% high in the week to 2.774%, a headwind for the USD/JPY due to its tight positive correlation.

USD/JPY Price Forecast: Technical outlook

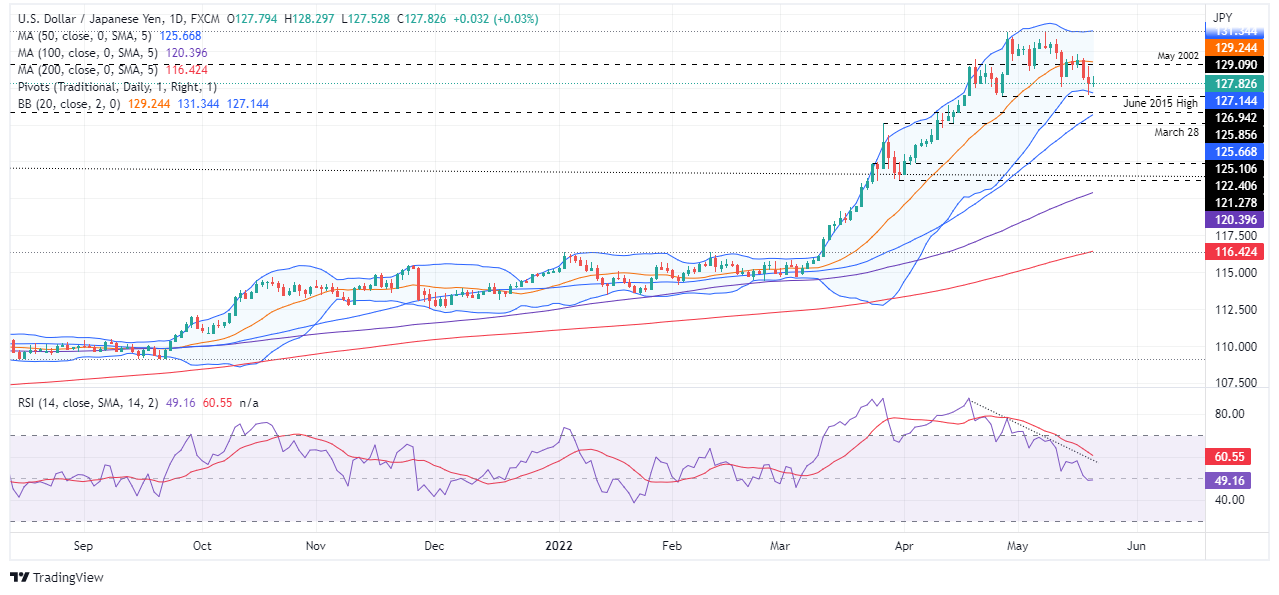
USD/JPY’s price action pushed the exchange rate towards the Bollinger’s band bottom line, at around 127.12, where some USD/JPY buyers lifted the price towards current price levels. It is worth noting that the USD/JPY shifted from upward biased to neutral due to the major staying trading in the 127.00-129.78 range, unable to trade beyond those boundaries, amid a lack of a fresh impetus that could rock the pair towards new weekly/yearly lows/highs, respectively.

Upwards, the USD/JPY first resistance would be 128.00. A breach of the latter would expose essential resistance levels. Firstly, May’s 18 daily high at 129.53, followed by the 130.00 mark, and the YTD high at 131.34. On the flip side, the USD/JPY’s first support would be May 19 daily low at 127.02. Break below would expose April’s 27 swing low at 126.94, followed by the 50-DMA at 125.66.

Key  Technical Levels

USD/JPY

Overview
Today last price 127.82
Today Daily Change -0.07
Today Daily Change % -0.05
Today daily open 127.8
 
Trends
Daily SMA20 129.3
Daily SMA50 125.48
Daily SMA100 120.29
Daily SMA200 116.35
 
Levels
Previous Daily High 128.94
Previous Daily Low 127.02
Previous Weekly High 131.35
Previous Weekly Low 127.52
Previous Monthly High 131.26
Previous Monthly Low 121.67
Daily Fibonacci 38.2% 127.76
Daily Fibonacci 61.8% 128.21
Daily Pivot Point S1 126.9
Daily Pivot Point S2 126
Daily Pivot Point S3 124.98
Daily Pivot Point R1 128.82
Daily Pivot Point R2 129.84
Daily Pivot Point R3 130.74


Share: Feed news

Information on these pages contains forward-looking statements that involve risks and uncertainties. Markets and instruments profiled on this page are for informational purposes only and should not in any way come across as a recommendation to buy or sell in these assets. You should do your own thorough research before making any investment decisions. FXStreet does not in any way guarantee that this information is free from mistakes, errors, or material misstatements. It also does not guarantee that this information is of a timely nature. Investing in Open Markets involves a great deal of risk, including the loss of all or a portion of your investment, as well as emotional distress. All risks, losses and costs associated with investing, including total loss of principal, are your responsibility. The views and opinions expressed in this article are those of the authors and do not necessarily reflect the official policy or position of FXStreet nor its advertisers. The author will not be held responsible for information that is found at the end of links posted on this page.

If not otherwise explicitly mentioned in the body of the article, at the time of writing, the author has no position in any stock mentioned in this article and no business relationship with any company mentioned. The author has not received compensation for writing this article, other than from FXStreet.

FXStreet and the author do not provide personalized recommendations. The author makes no representations as to the accuracy, completeness, or suitability of this information. FXStreet and the author will not be liable for any errors, omissions or any losses, injuries or damages arising from this information and its display or use. Errors and omissions excepted.

The author and FXStreet are not registered investment advisors and nothing in this article is intended to be investment advice.

Follow us on Telegram

Stay updated of all the news

Join Telegram

Recommended content


Follow us on Telegram

Stay updated of all the news

Join Telegram

Recommended content

Editors’ Picks

EUR/USD stays below 1.0900 as Q1 comes to an end

EUR/USD stays below 1.0900 as Q1 comes to an end

EUR/USD has lost its traction and declined below 1.0900 in the American session on Friday. Quarter-end flows seem to be allowing the US Dollar find some demand but the risk-positive market environment seems to be limiting the pair's downside ahead of the weekend.

EUR/USD News

GBP/USD trades below 1.2400, looks to post weekly gains

GBP/USD trades below 1.2400, looks to post weekly gains


GBP/USD has edged lower after having tested 1.2400 earlier in the day but remains on track to end the third straight week in positive territory. The upbeat mood remains intact after soft PCE inflation data from the US, making it difficult for the US Dollar to continue to gather strength.

GBP/USD News

Gold tries to stabilize near $1,980 following earlier spike

Gold tries to stabilize near $1,980 following earlier spike

Gold price has returned to the $1,980 area following a spike above $1,987 with the initial reaction to lower-than-expected PCE inflation figures from the US. Meanwhile, the benchmark 10-year US Treasury bond yield stays in the red near 3.5%, providing support to XAU/USD.

Gold News

Will Dogecoin price pull an XRP and rally 60% next week?

Will Dogecoin price pull an XRP and rally 60% next week?

Dogecoin price has been in a tight range bound movement since November 22. The recent recovery above the range low looks promising and hints at an explosive move for next week.

Read more

Week ahead – Nonfarm payrolls to set the tone for US dollar

Week ahead – Nonfarm payrolls to set the tone for US dollar

With the banking turmoil receding, market participants will turn their attention back to economic releases. The spotlight will fall on the US employment report.

Read more

Forex MAJORS

Cryptocurrencies

Signatures