USD/JPY Price Analysis: Pullback to Cloud/Bollinger-Band targets could be in play
- USD/JPY has traded through 109.73 key resistance and the 2018 trendline.
- Price is stalling just ahead of the Bolinger Band (BB) top.
- Bulls looking for a discount could look to the top of daily cloud confluence area.
- Bulls can target 110.50s for confluence resistance target.
- Failures here opens risk to 100% retracement of the recent rally from 107.80s – But, 200-DMA and 23.6% Fibo confluence first critical support target.

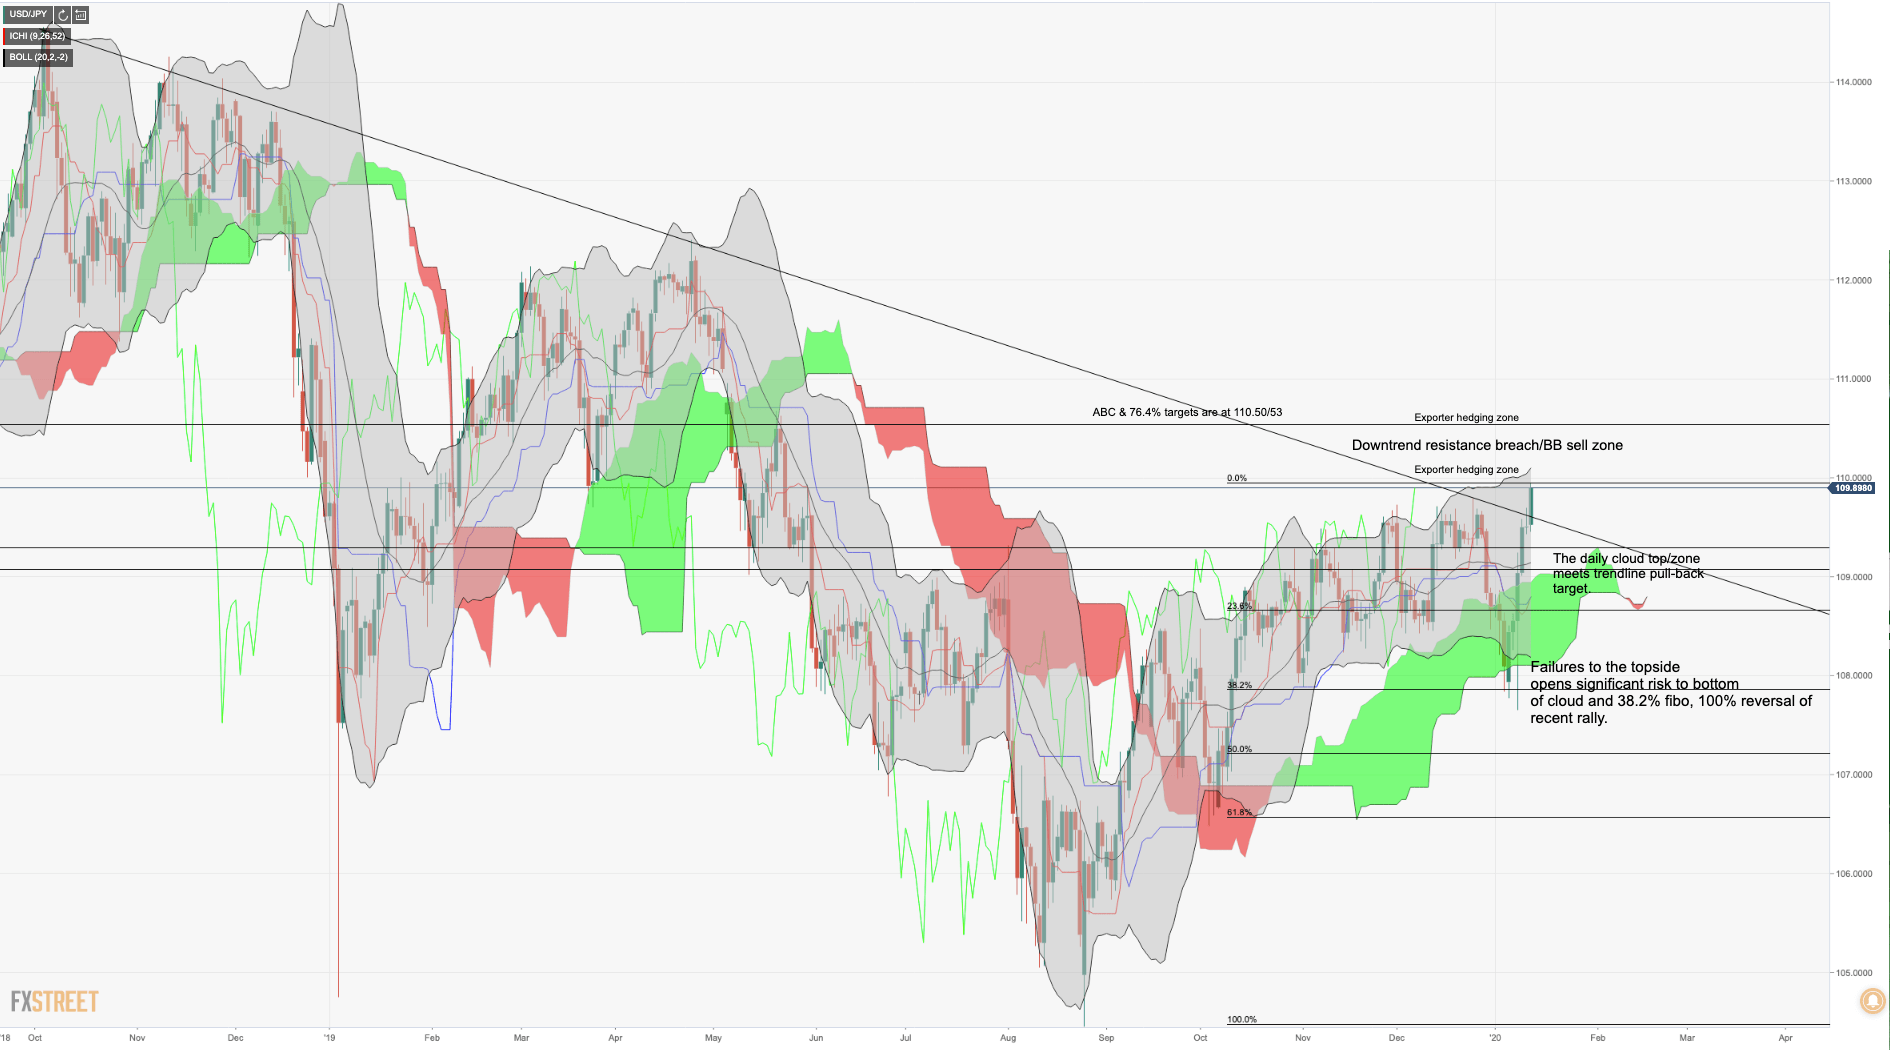
In an extension of the summer 2018 uptrend, bulls have taken out a key resistance (at the Dec 2 high of 109.73) area but now face hurdles in the psychological 110 zone where it meets the resistance of the Bollinger Band and exporter hedging zone.
There is risk of a pullback, offering a discount to committed bulls which could open an opportunity to add to longs at the top of the daily cloud and mid-point of the Bollinger Band meeting the 2018 bearish trendline. However, repeated upside failures, between 110/50 opens risk of a reversal of the recent rally back towards the 107 handle. The 200-day moving average and confluence of the 23.6% Fibo of the bull trend could be the first major support below 109 the figure and 4-hour 50/200 MA cross over – (see analysis).**
From a fundamental point of view, much now depends on how markets react to the signing on a phase-one trade deal between the US and China. The ambiguity of such a deal without a firm road map for subsequent negotiations on the more thornier issues opens prospects of a sell the fact/a flight to the yen situation which will not bode well for bulls committed to targets beyond the 110 handle.
Additional analysis of USD/JPY
Author

Ross J Burland
FXStreet
Ross J Burland, born in England, UK, is a sportsman at heart. He played Rugby and Judo for his county, Kent and the South East of England Rugby team.