|

Chart of the week: USD/JPY testing bear's commitments at key resistance, 109.70/80

  • USD/JPY is testing a monthly resistance line established in October 2018 and confluence of a 200-week moving average. 
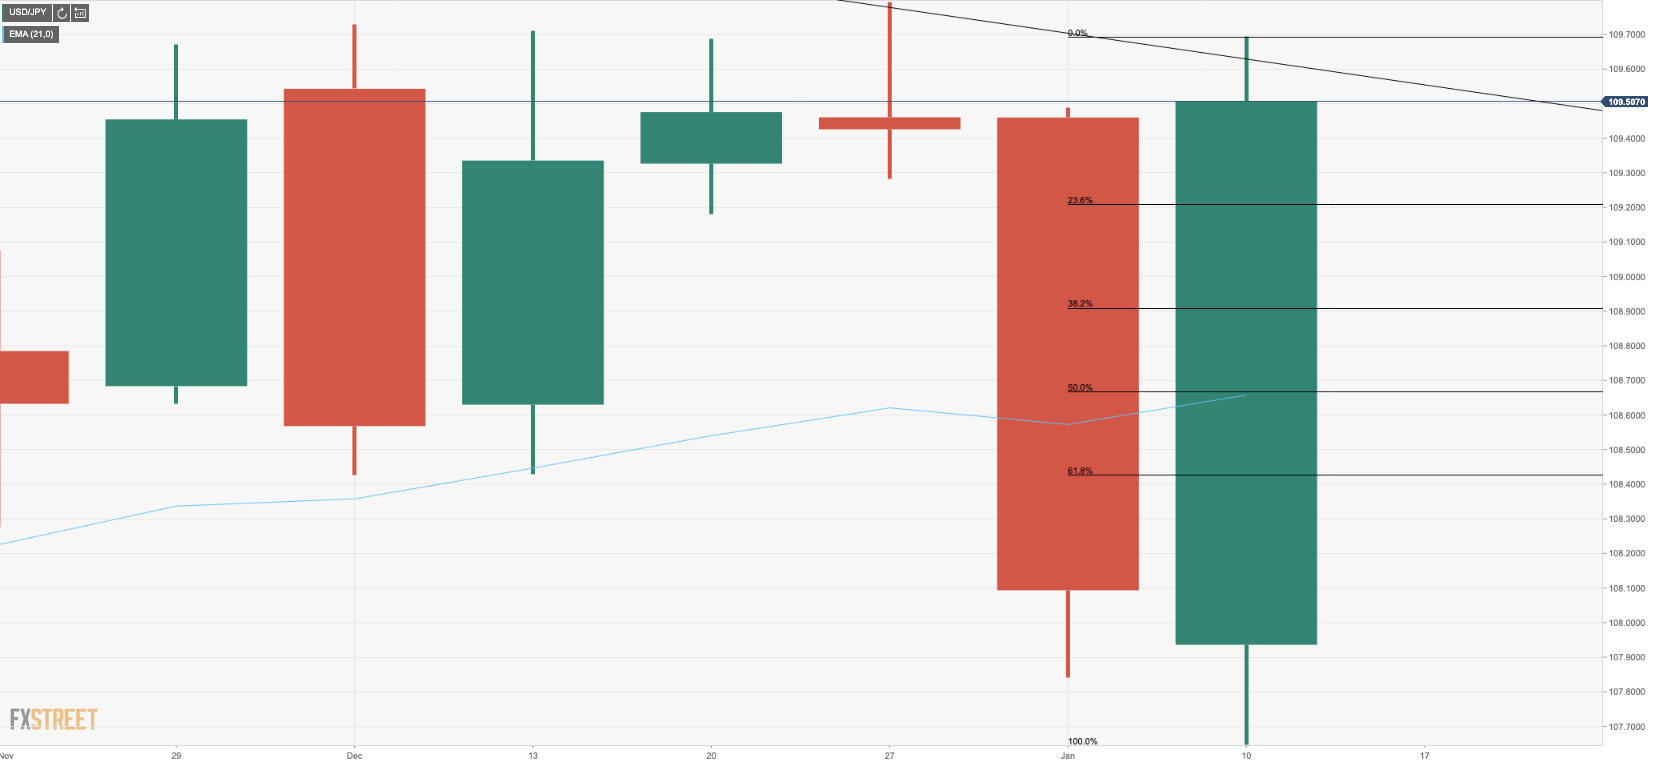
  • USD/JPY closed above the 50-month moving average, tested and pierced 21-month EMA.
  • Failures at this juncture open risk of a 50% mean reversion to 21-week moving average at 108.60/65.
  • 4-HR 500/200 moving average cross over in the making, albeit price stalling and RSI below OB territory, 109 to hold initial pullback. 

Weekly chart

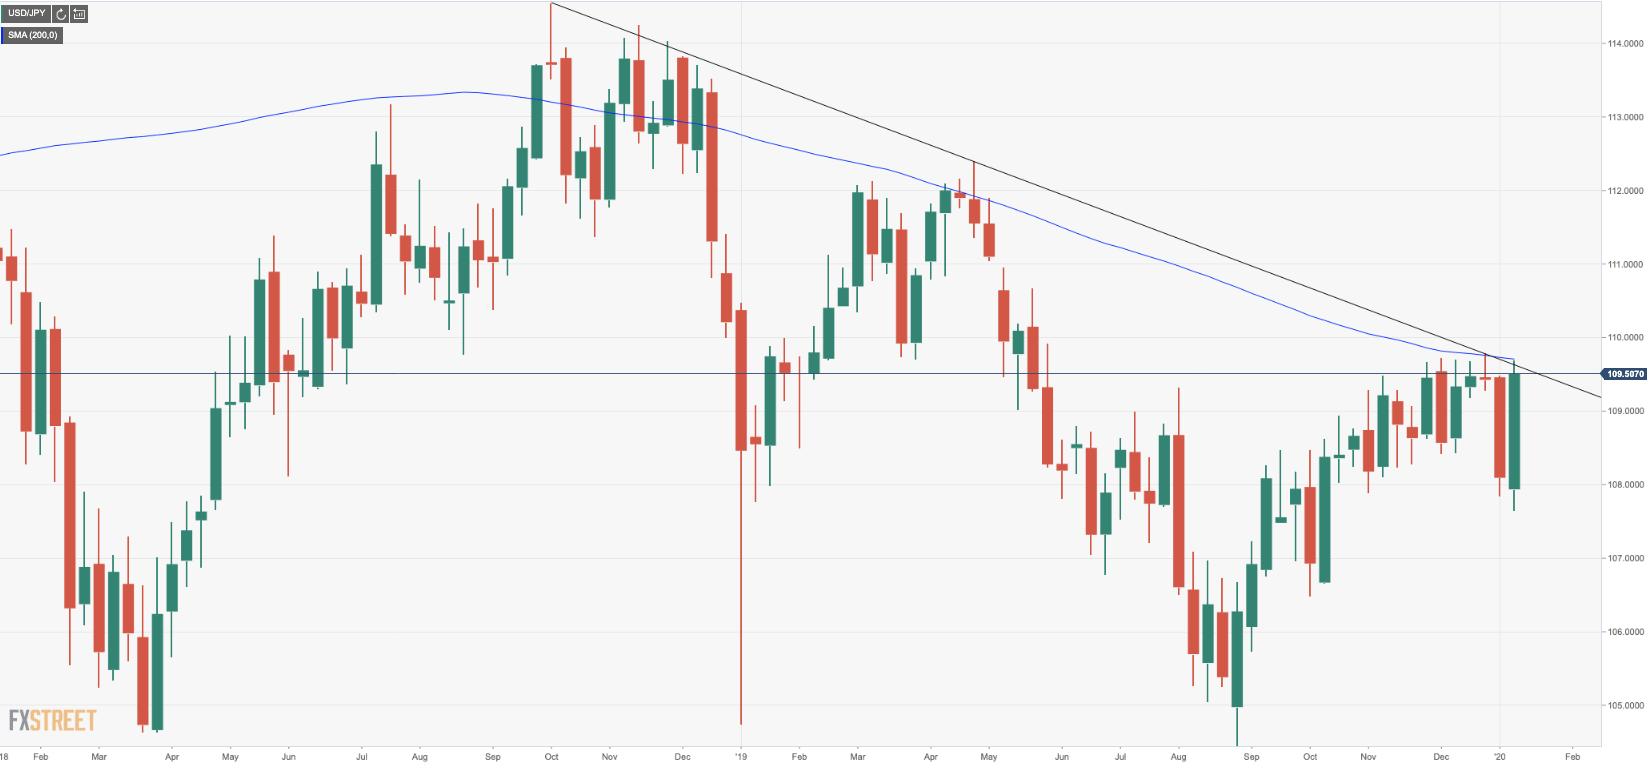
USD/JPY has surged in recent days to meet a monthly resistance line established in October 2018 that has the confluence of the 200-week moving average, a firm resistance around 109.70/80 which is expected to hold at this juncture, although a break of the resistance would be significant and set the stage for a sustained uptrend. 

21-Weekly EMA confluence with 50% mean reversion target

Bears can target a strong correction back to the 21-week EMA on failures below 109 the figure, meeting a 50% reversion point. This also has a confluence of the 200-DMA as seen below:

USD/JPY sliced above the 200-DMA

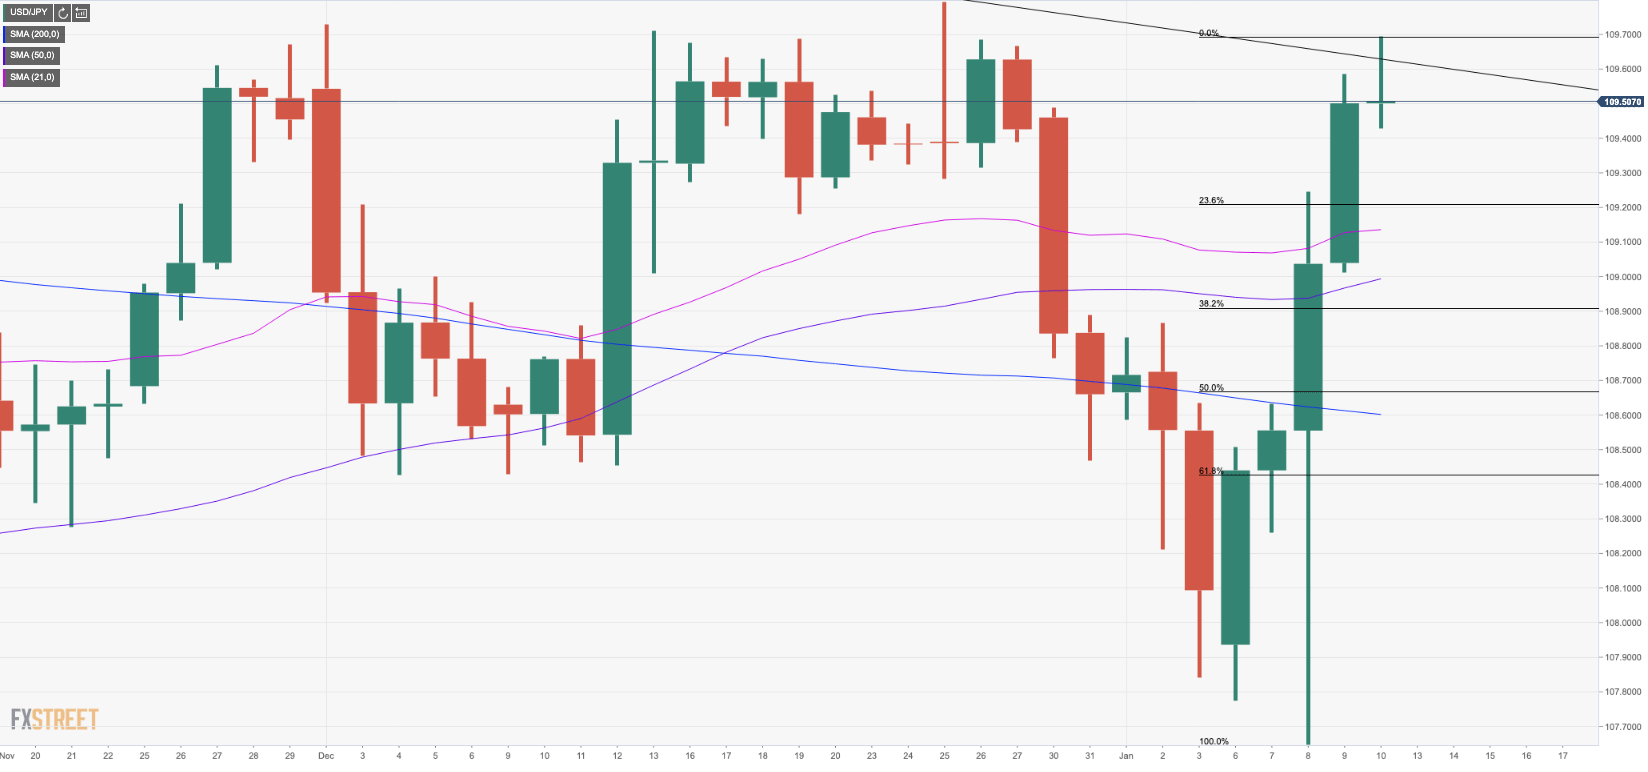
  • USD/JPY has comfortably broken through the 200-DMA, flirting with a topside breakout above 109.70 hard resistance with eyes on the 110 handle. However, while the US dollar stalls and geopolitical tensions remain in the driving seat, an imminent breakout is unlikely.
  • 109.20 (23.6% Fibo retracement) and the 21-day moving average at 109 the figure (38.2% Fibo 108.90) could be supportive into the highly anticipated so-called, 'phase-one' trade deal signing on the 15th Jan between US and Chinese officials. 

4-hour chart showing potential for key moving average cross-over 

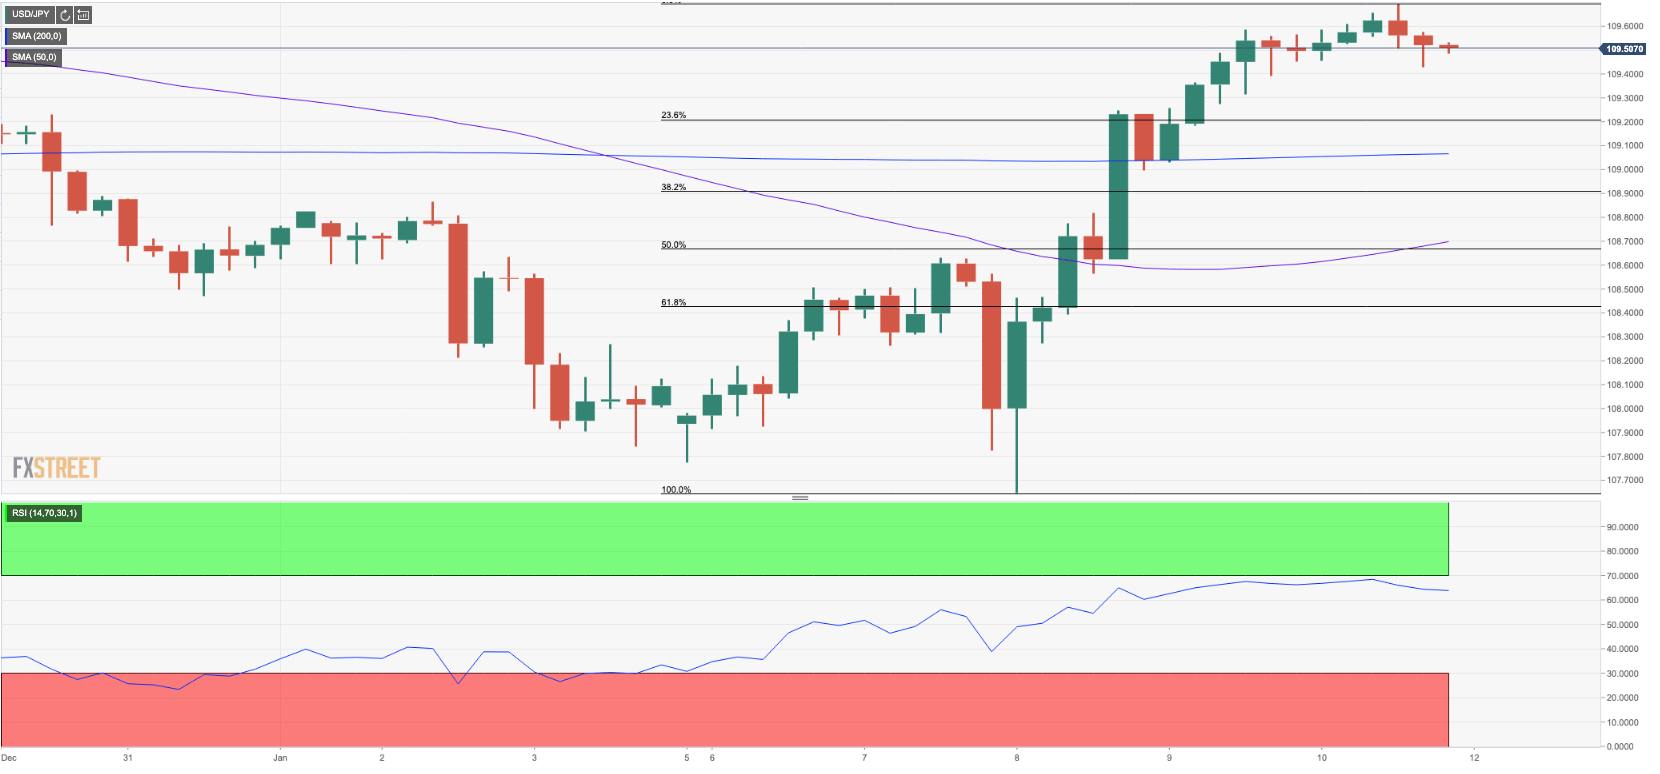
A golden cross is most commonly referred to a daily 50/200 moving average upside cross over, but it's worth noting on a 4-hour time frame as well and is often a significant development, as confirmation of a strong and ongoing trend. Should it occur on a break and hold above the hard resistance line, then bulls can be more satisfied with a higher conviction long position. 

Author

Ross J Burland

Ross J Burland, born in England, UK, is a sportsman at heart. He played Rugby and Judo for his county, Kent and the South East of England Rugby team.

More from Ross J Burland
Share:

Editor's Picks

AUD/USD bounces off weekly low on Israel-Lebanon ceasefire

AUD/USD recovers slightly from the weekly low during the Asian session on Thursday as a new Israel-Lebanon ceasefire keeps a lid on the safe-haven US Dollar. Meanwhile, the US and Iran remain at odds over key issues, which, along with hawkish Fed expectations, act as a tailwind for the buck. Furthermore, diminishing odds of an RBA rate hike in June cap the currency pair as traders keenly await the US NFP report on Friday.

USD/JPY remains close to 160.00 intervention threshold on Mideast tensions

USD/JPY struggles to find acceptance above 160.00 and retreats from a one-month high during the Asian session on Thursday amid fears that authorities will step in again to prop up the Japanese Yen. Furthermore, a new Israel-Lebanon ceasefire caps the US Dollar and supports the currency pair. However, renewed US-Iran tensions favor the USD bulls amid Fed rate hike bets and also hold back the JPY bulls from placing aggressive bets amid economic risks stemming from the Middle East conflict, suggesting that dips are likely to be bought into.

Gold bounces off one-week low; upside seems capped on Iran uncertainty

Gold recovers from a one-week low touched during the Asian session on Thursday, as news of an Israel-Lebanon ceasefire acts as a headwind for the safe-haven US Dollar. However, renewed hostilities in the Gulf, along with stalled US-Iran peace talks, keep geopolitical risks in play and should support the USD. Moreover, US-Iran tensions remain supportive of higher Crude Oil prices, fueling inflationary concerns and bolstering bets for higher interest rates for longer. This should cap the non-yielding bullion and warrants caution for bulls.


Bitcoin drops below $65K amid reinforced bear market signals

Bitcoin dipped further below $65,000 on Wednesday, with onchain data from Glassnode signaling a market firmly in a bear phase. The decline has pushed prices back into a key valuation range between the Realized Price and the True Market Mean. Glassnode noted that a key shift in market structure has also emerged.

The upside-down math of debt
In 2010, Professors Carmen Reinhart and Kenneth Rogoff published a paper, Growth in a Time of Debt, which instantly went viral. The main thesis of the paper was that once a government's debt-to-GDP ratio crosses above 90%, a financial crisis and default are around the corner.
Recession on paper: What really moves the Canadian Loonie now?

Statistics Canada handed the headline writers a gift and the analysts a headache. Real GDP shrank 0.1% on an annualized basis in the first quarter, and with the fourth quarter of 2025 revised down to a 1.0% contraction, that is two negative quarters in a row, the textbook definition of a technical recession and Canada's first since the pandemic.