|

USD/JPY Price Analysis: Looks vulnerable above 139.00

  • USD/JPY seems vulnerable above 139.00 as the USD Index is losing its charm.
  • BoJ Ueda said the central bank will discuss specifics of an exit policy when achievement of the price target is foreseen.
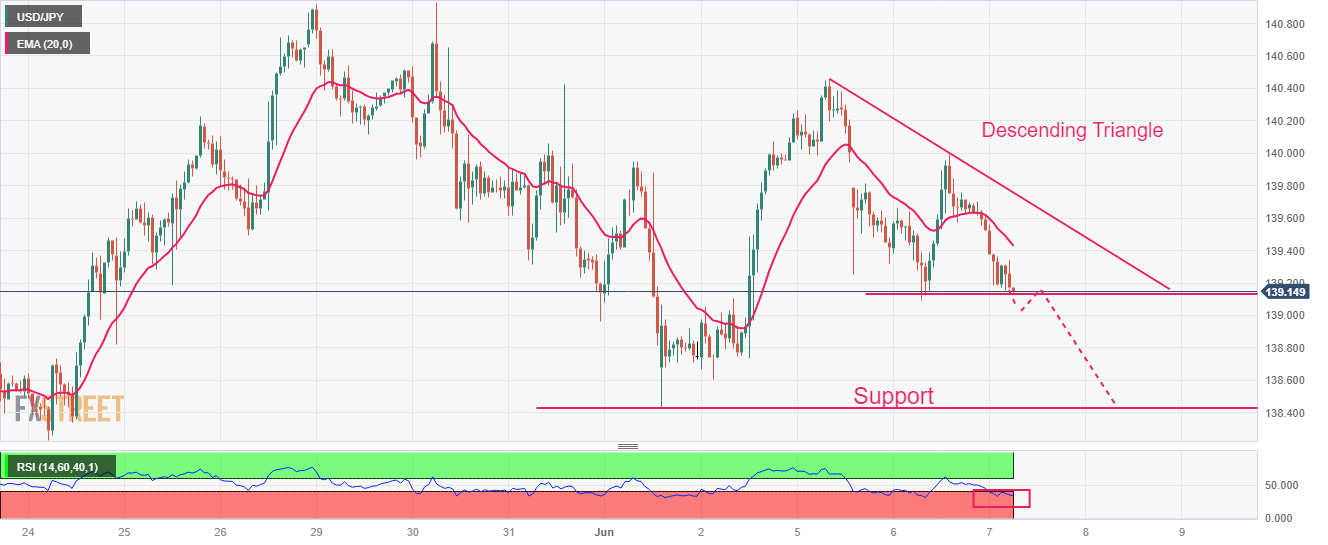
  • USD/JPY is expected to display a sheer downside after a breakdown of the Descending Triangle pattern.

The USD/JPY pair is juggling in a narrow range above the crucial support of 139.00 in the Asian session. The asset seems vulnerable above the aforementioned support as the US Dollar Index is losing its charm. Where major central banks are gearing up for a fresh interest rate hike, investors are anticipating that the Federal Reserve (Fed) could pause its policy-tightening spell as the impact of interest rate hikes yet made has not passed.

The US Dollar Index (DXY) has witnessed some support after correcting to near 104.00. A squeeze in volatility for the USD Index is anticipated amid an absence of potential economic events this week.

Meanwhile, the Japanese yen has got some strength as Bank of Japan (BoJ) Governor Kazuo Ueda said on Wednesday, “When achievement of price target is foreseen, we will discuss specifics of an exit policy and disclose information as needed.”

USD/JPY is on the verge of delivering a breakdown of the Descending Triangle chart pattern formed on an hourly scale. A breakdown of the aforementioned pattern results in wider ticks and heavy volume.

Declining 20-period Exponential Moving Average (EMA) at 139.43 adds to the downside filters.

The Relative Strength Index (RSI) (14) has shifted into the bearish range of 20.00-40.00, which indicates that downside momentum has been triggered.

A confident break below June 06 low at 139.09 will drag the asset toward March 08 high at 137.92 followed by March 02 high at 137.10

On the flip side, a break above May 31 high at 140.42 will drive the asset toward May 30 high at 140.93. A break above the latter will expose the asset to a fresh six-month high of around 141.61, which is 23 November 2022 high.

USD/JPY hourly chart

USD/JPY

Overview
Today last price139.17
Today Daily Change-0.47
Today Daily Change %-0.34
Today daily open139.64
 
Trends
Daily SMA20138.31
Daily SMA50135.65
Daily SMA100134.18
Daily SMA200137.3
 
Levels
Previous Daily High140
Previous Daily Low139.1
Previous Weekly High140.93
Previous Weekly Low138.43
Previous Monthly High140.93
Previous Monthly Low133.5
Daily Fibonacci 38.2%139.65
Daily Fibonacci 61.8%139.44
Daily Pivot Point S1139.16
Daily Pivot Point S2138.68
Daily Pivot Point S3138.26
Daily Pivot Point R1140.06
Daily Pivot Point R2140.48
Daily Pivot Point R3140.96

Author

Sagar Dua

Sagar Dua

FXStreet

Sagar Dua is associated with the financial markets from his college days. Along with pursuing post-graduation in Commerce in 2014, he started his markets training with chart analysis.

More from Sagar Dua
Share:

Editor's Picks

EUR/USD deflates to fresh lows, targets 1.1600

The selling pressure on EUR/USD now gathers extra pace, prompting the pair to hit fresh multi-week lows in the 1.1625-1.1620 band on Friday. The continuation of the downward bias comes in response to further gains in the US Dollar as market participants continue to assess the mixed release of US Nonfarm Payrolls in December.

GBP/USD breaks below 1.3400, challenges the 200-day SMA

GBP/USD remains under heavy fire and retreats for the fourth consecutive day on Friday. Indeed, Cable suffers the strong performance of the Greenback, intensified post-mixed NFP, and trades at shouting distance from its critical 200-day SMA near 1.3380.

Gold flirts with yearly tops around $4,500

Gold keeps its positive bias on Friday, adding to Thursday’s advance and challenging yearly highs in the $4,500 region per troy ounce. The risk-off sentiment favours the yellow metal despite the firmer tone in the Greenback and rising US Treasury yields.

Crypto Today: Bitcoin, Ethereum, XRP risk further decline as market fear persists amid slowing demand

Bitcoin holds $90,000 but stays below the 50-day EMA as institutional demand wanes. Ethereum steadies above $3,000 but remains structurally weak due to ETF outflows. XRP ETFs resume inflows, but the price struggles to gain ground above key support.

Week ahead – US CPI might challenge the geopolitics-boosted Dollar

Geopolitics may try to steal the limelight from US data. A possible US Supreme Court ruling on tariffs could dictate market movements. A crammed data calendar next week, US CPI comes on Tuesday; Fedspeak to intensify.

XRP trades under pressure amid weak retail demand

XRP presses down on the 50-day EMA support as risk-averse sentiment spreads despite a positive start to 2026. XRP faces declining retail demand, as reflected in futures Open Interest, which has fallen to $4.15 billion.