|

USD/JPY Price Analysis: Clings to modest gains, bulls await a move beyond mid-109.00s

  • USD/JPY attracted some dip-buying near the 109.00 mark and moved back closer to session tops.
  • Sustained move beyond mid-109.00s would set the stage for some near-term appreciating move.
  • Break below the 109.00 mark will negate the constructive outlook and prompt aggressive selling.

The USD/JPY pair reversed an intraday dip to the 109.00 area and climbed to the top end of its intraday trading range during the early North American session. The pair was last seen hovering just below mid-109.00s, up around 0.15% for the day.

The underlying bullish sentiment in the financial markets continued undermining demand for the safe-haven Japanese yen and extended some support to the USD/JPY pair. That said, the prevalent US dollar selling bias might keep a lid on any meaningful gains for the major.

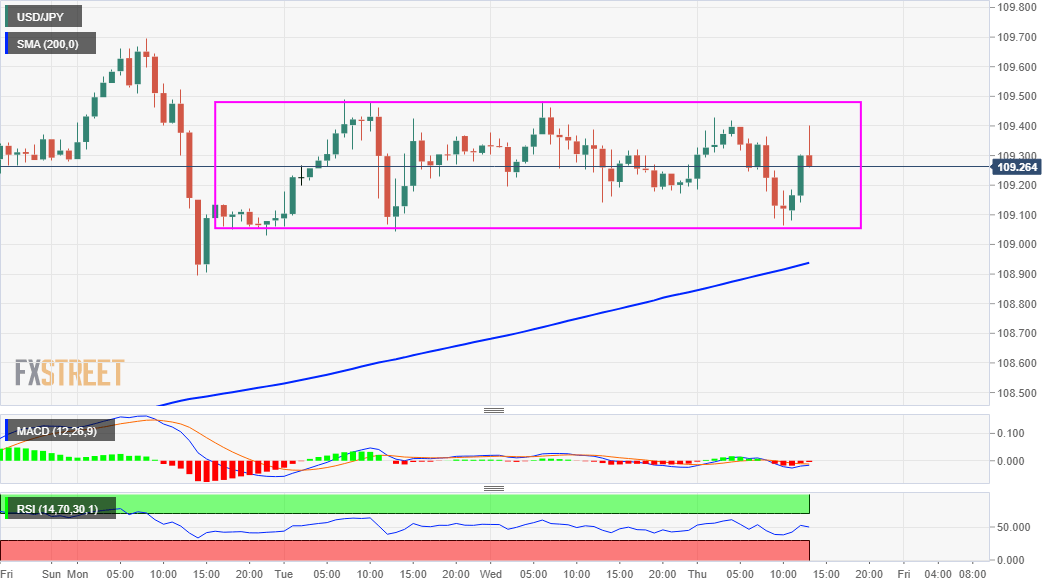
Looking at the technical picture, the 109.45-50 region has been capping the upside since Tuesday and should act as a pivotal point for short-term traders. Some follow-through buying has the potential to push the USD/JPY pair beyond weekly swing highs, around the 109.70 region.

Bulls might then aim back to reclaim the key 110.00 psychological mark before lifting the USD/JPY pair further towards the 110.55-60 resistance zone. The constructive outlook is reinforced by the fact that oscillators on the daily chart have just started gaining positive traction.

Hence, a subsequent strength towards the 110.55-60 resistance zone, en-route the 111.00 neighbourhood, or one-year tops touched in March, remains a distinct possibility.

On the flip side, the 109.00 round-figure mark now seems to have emerged as immediate strong support. Sustained weakness below might prompt some technical selling and accelerate the fall to the 108.65-60 support before the USD/JPY pair eventually drops to the 108.00 mark.

USD/JPY 1-hour chart

fxsoriginal

Technical levels to watch

USD/JPY

Overview
Today last price109.34
Today Daily Change0.10
Today Daily Change %0.09
Today daily open109.24
 
Trends
Daily SMA20108.77
Daily SMA50108.8
Daily SMA100106.51
Daily SMA200105.84
 
Levels
Previous Daily High109.48
Previous Daily Low109.14
Previous Weekly High109.37
Previous Weekly Low107.64
Previous Monthly High110.85
Previous Monthly Low107.48
Daily Fibonacci 38.2%109.27
Daily Fibonacci 61.8%109.35
Daily Pivot Point S1109.09
Daily Pivot Point S2108.95
Daily Pivot Point S3108.76
Daily Pivot Point R1109.43
Daily Pivot Point R2109.63
Daily Pivot Point R3109.77

Author

Haresh Menghani

Haresh Menghani is a detail-oriented professional with 10+ years of extensive experience in analysing the global financial markets.

More from Haresh Menghani
Share:

Editor's Picks

EUR/USD remains weak near 1.1800

EUR/USD rapidly fades Tuesday’s uptick and resumes its weekly retracement, challenging the 1.1800 support at the end of the NA session on Wednesday. The pair’s drop comes in response to extra gains in the US Dollar. Moving forward, the ECB meets on Thursday and is seen leaving its policy rate unchanged.
 

GBP/USD churns near 1.3700 ahead of BoE rate call

GBP/USD remains trapped in a near-term cycling pattern on Wednesday, continuing to churn aimlessly between 1.3700 and 1.3650. Cable traders are unlikely to pick a meaningful direction until after the Bank of England’s latest interest rate decision, due during Thursday’s London market session. 

Gold bulls refuse to give up yet, eyeing US jobs data

Gold is experiencing some volatility in Thursday’s Asian trading, moving back and forth in a roughly $200 range. Traders now look forward to the US JOLTS Job Openings data and geopolitical developments between the US and Iran for a clear directional impetus.

Top Crypto Losers: Zcash, Stacks, BNB drop further as Bitcoin weakens

Zcash, Stacks, and BNB are among the biggest losers over the last 24 hours as Bitcoin approaches $72,000 on Thursday. The correction is driven by multiple factors, including massive, steady outflows from institutions and large-wallet investors, broader-market risk-off sentiment, and the delay in the Digital Asset Clarity Act. 

The AI mirror just turned on tech and nobody likes the reflection

Tech just got hit with a different kind of selloff. Not the usual rates tantrum, not a recession whisper, not even an earnings miss in the classic sense. This was the market staring into an AI mirror and recoiling at its reflection.

Ripple stabilizes amid mixed signals as ETF inflows resume despite low retail activity

Ripple hovers around the $1.60 pivotal level at the time of writing on Wednesday, reflecting stable but weak sentiment across the crypto market. Intense volatility triggered a brief sell-off on Tuesday, driving the remittance token to pick up liquidity at $1.53 before recovering to the current level.