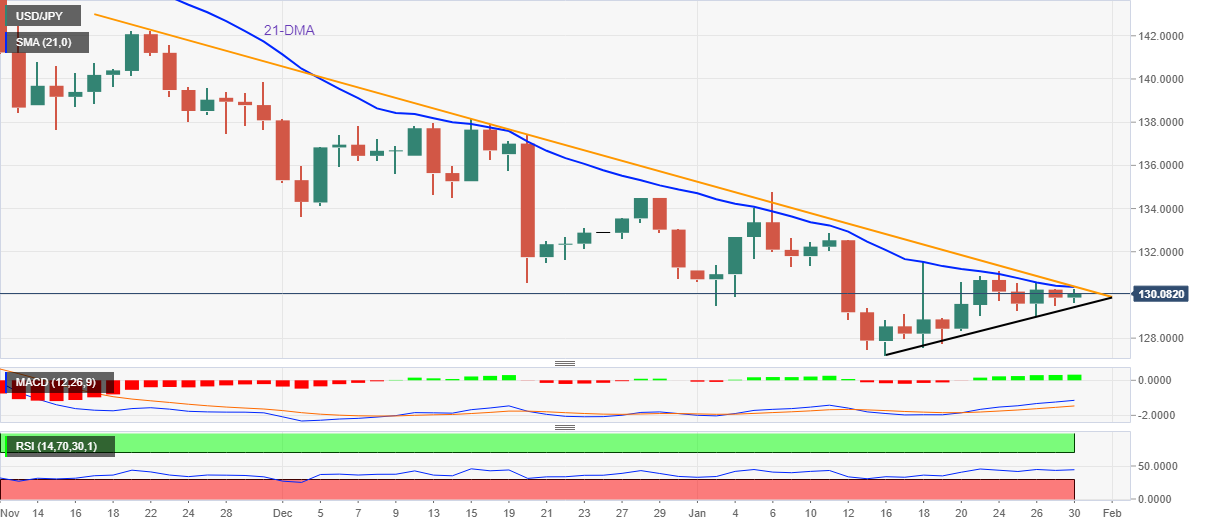
USD/JPY Price Analysis: Bulls attack 130.40 resistance confluence


  • USD/JPY grinds higher around intraday top after two-week rebound from multi-month low.
  • Convergence of 21-DMA, downward-sloping trend line from late November guards immediate upside.
  • Bullish MACD signals, firmer RSI (14) adds strength to the bullish bias.
  • Bears need validation from fortnight-old ascending trend line to retake control.

USD/JPY prints mild gains as buyers muster the courage to overcome the key 130.40 resistance confluence during early Monday morning, close to 130.10 by the press time.

In doing so, the Yen pair defends the two-week rebound from the lowest levels since May 2022 while staying above a fortnight-old ascending trend line.

Additionally favoring the USD/JPY buyers are the bullish MACD signals and the firmer RSI (14), not overbought.

However, a convergence of the 21-DMA and a two-month-long downward-sloping resistance line, around 130.40, appears a tough nut to crack for the pair buyers.

Following that, a run-up towards refreshing the monthly high near 134.80 can’t be ruled out.

During the anticipated rise past 130.40, the 131.00 round figure and January 18 high near 131.60 might probe the USD/JPY bulls.

On the contrary, a downside break of the aforementioned nearby support line, close to 129.40, could recall the USD/JPY bears targeting the monthly low of 127.20.

In a case where the USD/JPY sellers keep the reins past 127.20, the May 2022 low near 126.35 will be in focus.

Overall, USD/JPY bears appear to run out of steam but the buyers need validation from 130.40.

USD/JPY: Daily chart

Trend: Further upside expected

Additional important levels

Overview
Today last price 130.13
Today Daily Change 0.25
Today Daily Change % 0.19%
Today daily open 129.88
 
Trends
Daily SMA20 130.38
Daily SMA50 133.83
Daily SMA100 139.46
Daily SMA200 136.76
 
Levels
Previous Daily High 130.28
Previous Daily Low 129.5
Previous Weekly High 131.12
Previous Weekly Low 129.02
Previous Monthly High 138.18
Previous Monthly Low 130.57
Daily Fibonacci 38.2% 129.8
Daily Fibonacci 61.8% 129.98
Daily Pivot Point S1 129.49
Daily Pivot Point S2 129.11
Daily Pivot Point S3 128.71
Daily Pivot Point R1 130.27
Daily Pivot Point R2 130.67
Daily Pivot Point R3 131.05


Share: Feed news

Information on these pages contains forward-looking statements that involve risks and uncertainties. Markets and instruments profiled on this page are for informational purposes only and should not in any way come across as a recommendation to buy or sell in these assets. You should do your own thorough research before making any investment decisions. FXStreet does not in any way guarantee that this information is free from mistakes, errors, or material misstatements. It also does not guarantee that this information is of a timely nature. Investing in Open Markets involves a great deal of risk, including the loss of all or a portion of your investment, as well as emotional distress. All risks, losses and costs associated with investing, including total loss of principal, are your responsibility. The views and opinions expressed in this article are those of the authors and do not necessarily reflect the official policy or position of FXStreet nor its advertisers. The author will not be held responsible for information that is found at the end of links posted on this page.

If not otherwise explicitly mentioned in the body of the article, at the time of writing, the author has no position in any stock mentioned in this article and no business relationship with any company mentioned. The author has not received compensation for writing this article, other than from FXStreet.

FXStreet and the author do not provide personalized recommendations. The author makes no representations as to the accuracy, completeness, or suitability of this information. FXStreet and the author will not be liable for any errors, omissions or any losses, injuries or damages arising from this information and its display or use. Errors and omissions excepted.

The author and FXStreet are not registered investment advisors and nothing in this article is intended to be investment advice.

Recommended content


Recommended content

Editors’ Picks

EUR/USD edges lower toward 1.0700 post-US PCE

EUR/USD edges lower toward 1.0700 post-US PCE

EUR/USD stays under modest bearish pressure but manages to hold above 1.0700 in the American session on Friday. The US Dollar (USD) gathers strength against its rivals after the stronger-than-forecast PCE inflation data, not allowing the pair to gain traction.

EUR/USD News

GBP/USD retreats to 1.2500 on renewed USD strength

GBP/USD retreats to 1.2500 on renewed USD strength

GBP/USD lost its traction and turned negative on the day near 1.2500. Following the stronger-than-expected PCE inflation readings from the US, the USD stays resilient and makes it difficult for the pair to gather recovery momentum.

GBP/USD News

Gold struggles to hold above $2,350 following US inflation

Gold struggles to hold above $2,350 following US inflation

Gold turned south and declined toward $2,340, erasing a large portion of its daily gains, as the USD benefited from PCE inflation data. The benchmark 10-year US yield, however, stays in negative territory and helps XAU/USD limit its losses. 

Gold News

Bitcoin Weekly Forecast: BTC’s next breakout could propel it to $80,000 Premium

Bitcoin Weekly Forecast: BTC’s next breakout could propel it to $80,000

Bitcoin’s recent price consolidation could be nearing its end as technical indicators and on-chain metrics suggest a potential upward breakout. However, this move would not be straightforward and could punish impatient investors. 

Read more

Week ahead – Hawkish risk as Fed and NFP on tap, Eurozone data eyed too

Week ahead – Hawkish risk as Fed and NFP on tap, Eurozone data eyed too

Fed meets on Wednesday as US inflation stays elevated. Will Friday’s jobs report bring relief or more angst for the markets? Eurozone flash GDP and CPI numbers in focus for the Euro.

Read more

Forex MAJORS

Cryptocurrencies

Signatures