|

USD/JPY Price Analysis: Bears keep the reins around mid-135.00s amid pre-Fed caution

  • USD/JPY prints mild losses as markets turn dicey ahead of the key events.
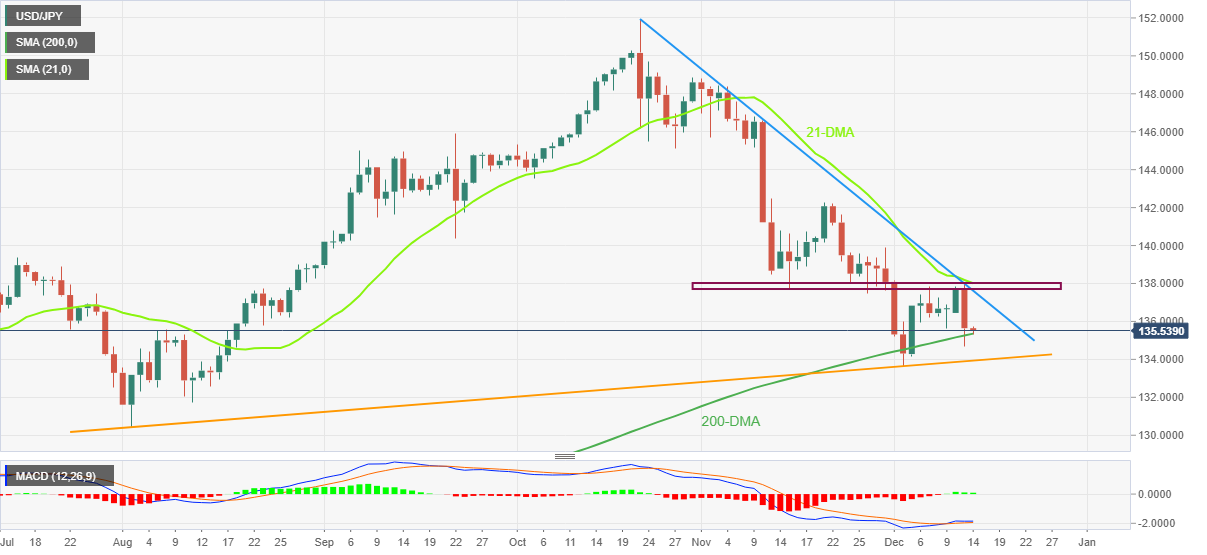
  • 200-DMA, four-month-old support line defend buyers amid bullish MACD signals.
  • Sellers remain hopeful unless witnessing a clear break of 138.00 hurdle.

USD/JPY struggles to defend the bounce off the 200-DMA as it seesaws around 135.50 during early Wednesday morning in Europe. In doing so, the Yen pair portrays the market’s cautious mood ahead of the key Federal Open Market Committee (FOMC) monetary policy meeting.

Also read: Fed December Preview: Will US Dollar selloff continue?

It’s worth noting that the looming bear cross on the MACD and multiple hurdles to the north keeps the USD/JPY bears hopeful.

That said, the quote dropped the most in two weeks while reversing from a one-month-old horizontal resistance area comprising a downward-sloping resistance line from October 21, the 21-DMA and multiple tops marked since November 15, around 137.70-138.00.

Hence, the USD/JPY pair’s weakness below the 200-DMA level surrounding 135.35 appears imminent. In that case, an ascending support line from early August, near 133.90, will gain the market’s attention.

Should the Yen pair breaks the 133.90 key support, it becomes vulnerable to challenging August month’s low near 130.40.

Alternatively, an upside clearance of the 138.00 hurdle could recall the USD/JPY bulls targeting the late November swing high of 142.25. During the run-up, the 140.00 threshold may act as an intermediate halt.

Overall, USD/JPY is likely to decline further but the downside appears limited.

USD/JPY: Daily chart

Trend: Limited downside expected

Additiona important levels

Overview
Today last price135.5
Today Daily Change-0.14
Today Daily Change %-0.10%
Today daily open135.64
 
Trends
Daily SMA20138.14
Daily SMA50143.04
Daily SMA100141.09
Daily SMA200135.26
 
Levels
Previous Daily High137.97
Previous Daily Low134.66
Previous Weekly High137.86
Previous Weekly Low134.13
Previous Monthly High148.82
Previous Monthly Low137.5
Daily Fibonacci 38.2%135.92
Daily Fibonacci 61.8%136.7
Daily Pivot Point S1134.21
Daily Pivot Point S2132.78
Daily Pivot Point S3130.89
Daily Pivot Point R1137.52
Daily Pivot Point R2139.4
Daily Pivot Point R3140.84

Author

Anil Panchal

Anil Panchal

FXStreet

Anil Panchal has nearly 15 years of experience in tracking financial markets. With a keen interest in macroeconomics, Anil aptly tracks global news/updates and stays well-informed about the global financial moves and their implications.

More from Anil Panchal
Share:

Editor's Picks

AUD/USD falls to near 0.7100 after slipping below 50-day EMA

AUD/USD depreciates after registering minor gains in the previous day, trading around 0.7120 during the Asian hours. The technical analysis of the daily chart shows the pair consolidating sideways within a rectangle pattern, as neither bulls nor bears gain control. The AUD/USD pair is holding a slight bearish tone however as it sits beneath both the nine-day and 50-day EMAs.

160.00: USD/JPY back near intervention territory after upbeat US jobs report

US Nonfarm Payrolls beat expectations by a wide margin in May, with 172K jobs added. The US Dollar rebounds after the release, helping USD/JPY recover from its intraday lows. Warnings from Japanese authorities continue to limit upside potential near the 160.00 threshold.

Gold targets $4,300 amid stronger Dollar

Gold faces increasing selling interest and navigates the area of three-month lows near the $4,300 mark per troy ounce on Friday. The precious metal’s decline comes as traders assess the stronger-than-expected NFP, while the bid bias in the Greenback and higher US Treasury yields also collaborate with the retracement.

Cardano hits five-year low even as Hoskinson clarifies "break" isn't an exit

Cardano (ADA) price is down 10% at press time on Friday, extending losses over 30% so far this week amid Charles Hoskinson's clarification that "break" isn't an exit.

Week ahead – Fed countdown begins amid US inflation data and geopolitical risks

Fed Chair Warsh’s first meeting approaches as key US inflation data could reshape expectations. Oil prices remain elevated as US-Iran talks continue; tariffs also return to the spotlight. ECB is expected to hike; will it be a one-off move or is July live?

The US economy defies the rules: 100 days into the Oil shock and the recession signal is still missing

More than three months after the start of the Iran war and the resulting disruption to global energy markets, the US economy continues to display remarkable resilience. The conflict has triggered a sharp rise in Oil prices, reignited inflationary pressures and fueled widespread concerns about a potential economic slowdown.