USD/JPY hits new YTD high amid Fed/BoJ monetary policy divergence
- USD/JPY surges to a new YTD high of 146.68, buoyed by Wall Street’s upbeat opening and dovish comments from BoJ Governor Kazuo Ueda.
- Despite a dip in US 10-year Treasury yields, the pair maintains its bullish momentum, reflecting the Fed’s hawkish stance on further tightening.
- A packed economic calendar could introduce volatility, including key US and Japanese indicators.

USD/JPY resumes its uptrend, prints a new year-to-date (YTD) high of 146.68, on an upbeat sentiment, with Wall Street opening the week on a higher note amidst thin liquidity conditions due to the UK’s Summer Bank Holiday. Hence, the Japanese Yen (JPY) extended its losses to three straight sessions spurred by dovish remarks by the Bank of Japan’s (BoJ) Governor Kazuo Ueda. The pair exchanges hands at 146.60.
Japanese Yen extends its losses as Wall Street climbs and BoJ’s Ueda remains dovish
US equities resumed their uptrend following hawkish remarks by the US Federal Reserve (Fed) Chair Jerome Powell at Jackson Hole. Despite being data-dependent, Powell’s words reinforced the US central bank hawkish stance, which triggered a leg-up in the USD/JPY pair. He added that robust economic expansion and the constrained labor market would warrant further tightening by the Fed if those economic indicators don’t show signs of easing.
The USD/JPY advance stalled as US Treasury bond yields began to lose ground, particularly the US 10-year Treasury Note, with its coupon sliding two basis points at 4.22% and undermining the greenback.
On the Japanese front, the BoJ Governor Kazuo Ueda said that underlying inflation is still below target and justified the current “dovish” monetary policy stance by the BoJ, even though July’s core consumer inflation rose by 3.1%. Ueda added that inflation “is expected to decline.”
Although the BoJ tweaked its Yield Curve Control (YCC) to a 0.50%-1% flexible target, the 10-year Japanese Government Bonds (JGBs) yield has failed to break higher, which could shift the USD/JPY pair bias bearish. Once the BoJ signals it is ready to normalize its monetary policy, the USD/JPY could resume lower after posting gains of 11.85% in the year.
A busy economic calendar could rock the boat in the week ahead. The US docket would feature JOLTs report, the CB Consumer Confidence, the release of the Gross Domestic Product, the Fed’s preferred gauge for inflation, the core PCE, US employment data, and business activity. On the Japanese front, speeches by two BoJ members.
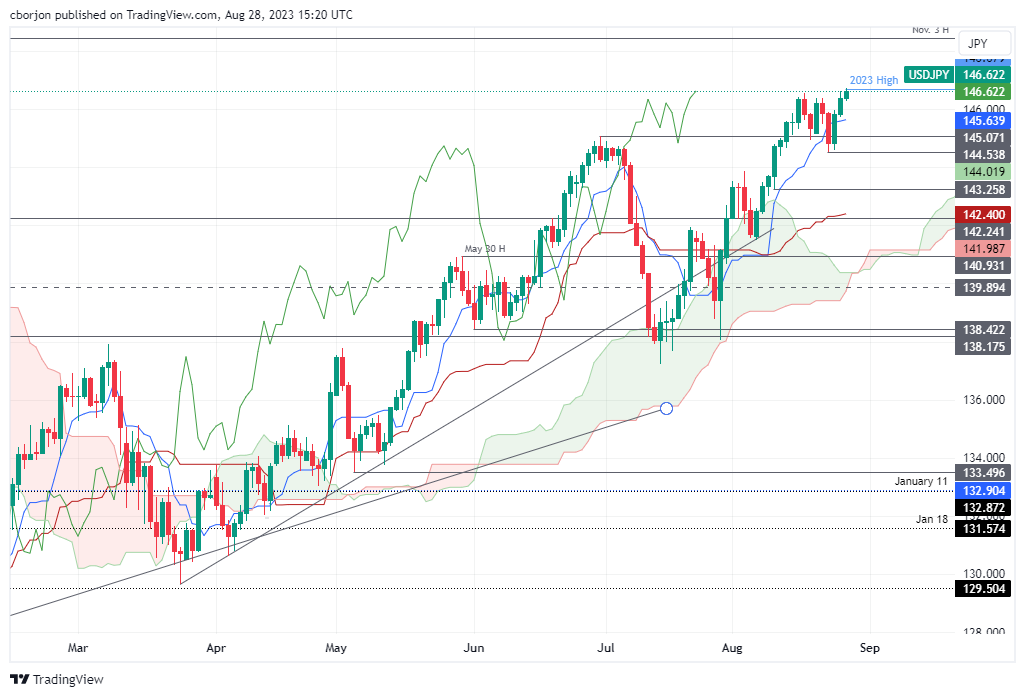
USD/JPY Price Analysis: Technical outlook
The US Dollar rally against the Japanese Yen is set to continue if not for vocal expressions of Japanese authorities threatening to intervene in the FX markets. After hitting a new YTD high, the USD/JPY could extend its gains towards the November 3 high at 148.45, followed by the October 31 high at 148.84, before piercing 149.00. The major’s downside risks emerge at the Tenkan-Sen line at 145.61. If breached, the next stop would be the August 23 swing low of 144.54.
Author

Christian Borjon Valencia
FXStreet
Markets analyst, news editor, and trading instructor with over 14 years of experience across FX, commodities, US equity indices, and global macro markets.


