|

USD/INR technical analysis: Sellers can enter as 12-day old support-line breaks

  • USD/INR remains below short-term support-line.
  • The three-day-old horizontal resistance limits the immediate upside.
  • 38.2% Fibonacci retracement can lure sellers.

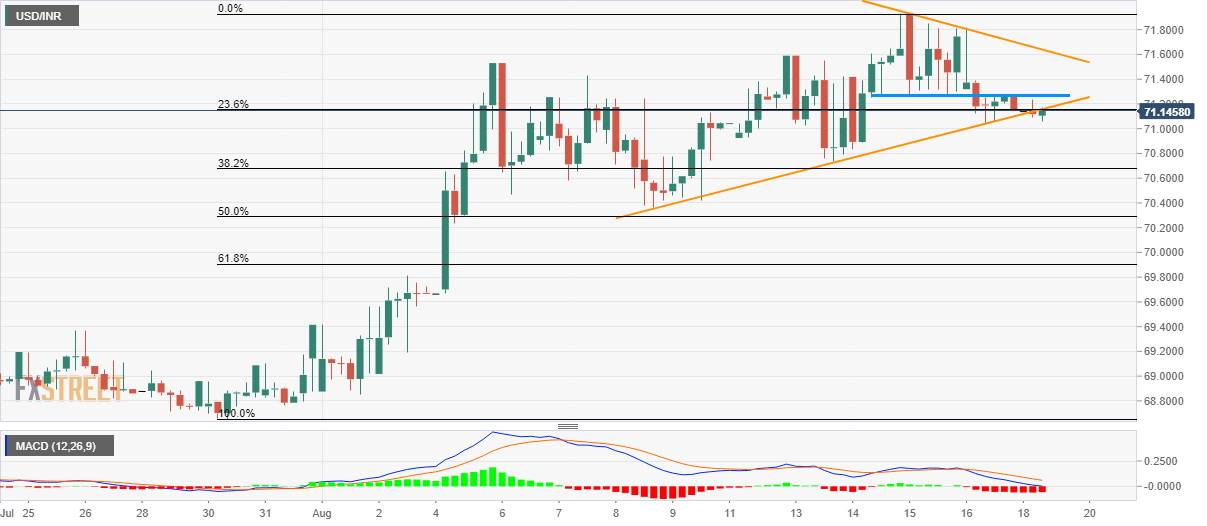
Having breached a 12-day old support-line, the USD/INR pair takes the rounds to 71.16 ahead of Monday’s European session.

Not only pair’s decline below ascending trend-line but sustained trading below three-day-old horizontal-area also increases the odds for its declines to 38.2% Fibonacci retracement level of July-end to mid-August upside at 70.68.

During the quote’s extended south-run below 70.68, 50% Fibonacci retracement near 70.30 and 70.00 round-figure will lure bears.

Meanwhile, pair’s pullback needs to cross 71.25/28 horizontal resistance in order to target immediate descending trend-line at 71.65, a break of which can propel prices to monthly top surrounding 71.94.

It should also be noted that 12-bar moving average convergence and divergence (MACD) flashes bearish signal.

USD/INR 4-hour chart

 Trend: Pullback expected

    1. R3 72.3923 
    2. R2 72.1037 
    3. R1 71.6228 
  1. PP 71.3342 
    1. S1 70.8533
    2. S2  70.5647
    3. S3  70.0838

Author

Anil Panchal

Anil Panchal

FXStreet

Anil Panchal has nearly 15 years of experience in tracking financial markets. With a keen interest in macroeconomics, Anil aptly tracks global news/updates and stays well-informed about the global financial moves and their implications.

More from Anil Panchal
Share:

Editor's Picks

EUR/USD remains offered below 1.1600, seems vulnerable near multi-month low

The EUR/USD pair struggles to capitalize on the overnight bounce from the 1.1530 region, or the lowest level since November 2025, and lower for the third consecutive day on Wednesday. Spot prices slide back below the 1.1600 mark during the Asian session and seem vulnerable to slide further.

GBP/USD slips below key averages as geopolitical risks mount

GBP/USD fell about 0.35% on Tuesday, settling around 1.3350 after slipping below the 200-day Exponential Moving Average for the first time since early December. The pair has pulled back sharply from its late-January high near 1.3870, shedding over 500 pips in a series of lower highs and lower lows. 

Gold moves closer to $5,150 amid sustained safe-haven flows

Gold climbs back above $5,100 during the Asian session on Wednesday, moving away from an over one-week low, touched the previous day. Sustained safe-haven flow, amid escalating geopolitical tensions in the Middle East, acts as a tailwind for the bullion. However, a bullish US Dollar and reduced bets for more aggressive easing by the US Fed might keep a lid on the non-yielding yellow metal ahead of the US ADP report and ISM Services PMI later today.

Ethereum: Whales step up buying as short positions contract

After holding firm heading into the last weekend, Ethereum whales have returned to action, pouncing on the volatility stemming from escalating military actions between the US and Iran.

Energy shock 2.0: Why rising Gas prices could hit the Euro

Even without a confirmed, sustained disruption, the mere risk to a key global energy chokepoint is enough to inject a significant premium into European Gas markets. And for the Euro, that matters.

Ripple falters amid sell-off jitters and negative funding rates

Ripple (XRP) has come under pressure, drifting lower to $1.35 at the time of writing on Tuesday. The over 2% correction looks poised to erase the previous day’s gains, which lifted the remittance token to $1.42.