USD/INR Price News: Indian rupee poised for further losses towards 75.00


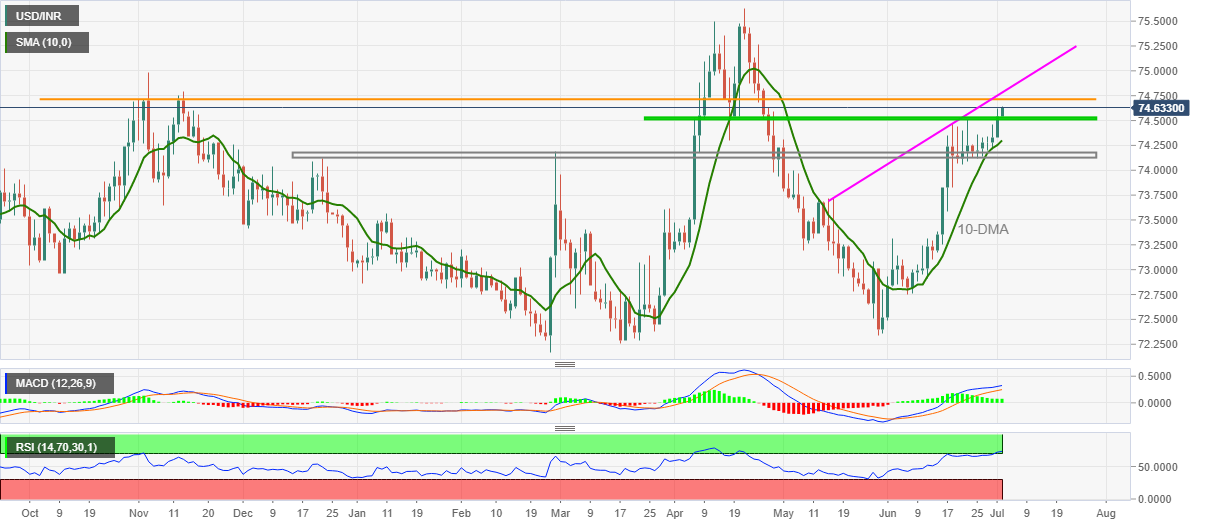
  • USD/INR refreshes seven-week top, following a three-month-old resistance break.
  • Bullish MACD, sustained breakout keeps pair buyers hopeful.
  • Horizontal line from November 2020, seven-week-long resistance line probe bulls.
  • 10-DMA adds to the downside support ahead of the key 74.18–12 area.

USD/INR justifies the upside break of a three-month-old resistance, now support, while refreshing the highest levels since April 27 during early Friday. That said, the Indian rupee (INR) bears print 74.63 as a quote versus the US dollar, up 0.12% intraday, ahead of the critical US jobs report.

Given the pair’s successful break of the previously important horizontal resistance, backed by bullish MACD and trading above 10-DMA, USD/INR braces for another horizontal hurdle stretched from early November, surrounding $74.70.

However, any further upside past-74.70 will be questioned by an ascending trend line from May 14, near 74.80, a break of which could recall the 75.00 threshold to the chart.

Meanwhile, a downside break of the resistance-turned-support near 74.50 may bounce off the 10-DMA level of 74.30 before highlighting the 74.18-12 region for USD/INR sellers, comprising multiple levels marked since late December 2020.

It’s worth noting that the overbought RSI conditions and receding bullish bias of MACD may trigger the pair’s pullback moves from the nearby resistances. Though, it all depends upon the US Nonfarm Payrolls and hence traders should be cautious ahead of the event.

USD/INR: Daily chart

Trend: Bullish

Additional important levels

Overview
Today last price 74.669
Today Daily Change 0.1245
Today Daily Change % 0.17%
Today daily open 74.5445
 
Trends
Daily SMA20 73.7527
Daily SMA50 73.5627
Daily SMA100 73.4513
Daily SMA200 73.5074
 
Levels
Previous Daily High 74.624
Previous Daily Low 74.3316
Previous Weekly High 74.5135
Previous Weekly Low 74.0585
Previous Monthly High 74.5135
Previous Monthly Low 72.4854
Daily Fibonacci 38.2% 74.5123
Daily Fibonacci 61.8% 74.4433
Daily Pivot Point S1 74.3761
Daily Pivot Point S2 74.2076
Daily Pivot Point S3 74.0837
Daily Pivot Point R1 74.6685
Daily Pivot Point R2 74.7924
Daily Pivot Point R3 74.9609


Share: Feed news

Information on these pages contains forward-looking statements that involve risks and uncertainties. Markets and instruments profiled on this page are for informational purposes only and should not in any way come across as a recommendation to buy or sell in these assets. You should do your own thorough research before making any investment decisions. FXStreet does not in any way guarantee that this information is free from mistakes, errors, or material misstatements. It also does not guarantee that this information is of a timely nature. Investing in Open Markets involves a great deal of risk, including the loss of all or a portion of your investment, as well as emotional distress. All risks, losses and costs associated with investing, including total loss of principal, are your responsibility. The views and opinions expressed in this article are those of the authors and do not necessarily reflect the official policy or position of FXStreet nor its advertisers. The author will not be held responsible for information that is found at the end of links posted on this page.

If not otherwise explicitly mentioned in the body of the article, at the time of writing, the author has no position in any stock mentioned in this article and no business relationship with any company mentioned. The author has not received compensation for writing this article, other than from FXStreet.

FXStreet and the author do not provide personalized recommendations. The author makes no representations as to the accuracy, completeness, or suitability of this information. FXStreet and the author will not be liable for any errors, omissions or any losses, injuries or damages arising from this information and its display or use. Errors and omissions excepted.

The author and FXStreet are not registered investment advisors and nothing in this article is intended to be investment advice.

Recommended content


Recommended content

Editors’ Picks

EUR/USD edges lower toward 1.0700 post-US PCE

EUR/USD edges lower toward 1.0700 post-US PCE

EUR/USD stays under modest bearish pressure but manages to hold above 1.0700 in the American session on Friday. The US Dollar (USD) gathers strength against its rivals after the stronger-than-forecast PCE inflation data, not allowing the pair to gain traction.

EUR/USD News

GBP/USD retreats to 1.2500 on renewed USD strength

GBP/USD retreats to 1.2500 on renewed USD strength

GBP/USD lost its traction and turned negative on the day near 1.2500. Following the stronger-than-expected PCE inflation readings from the US, the USD stays resilient and makes it difficult for the pair to gather recovery momentum.

GBP/USD News

Gold struggles to hold above $2,350 following US inflation

Gold struggles to hold above $2,350 following US inflation

Gold turned south and declined toward $2,340, erasing a large portion of its daily gains, as the USD benefited from PCE inflation data. The benchmark 10-year US yield, however, stays in negative territory and helps XAU/USD limit its losses. 

Gold News

Bitcoin Weekly Forecast: BTC’s next breakout could propel it to $80,000 Premium

Bitcoin Weekly Forecast: BTC’s next breakout could propel it to $80,000

Bitcoin’s recent price consolidation could be nearing its end as technical indicators and on-chain metrics suggest a potential upward breakout. However, this move would not be straightforward and could punish impatient investors. 

Read more

Week ahead – Hawkish risk as Fed and NFP on tap, Eurozone data eyed too

Week ahead – Hawkish risk as Fed and NFP on tap, Eurozone data eyed too

Fed meets on Wednesday as US inflation stays elevated. Will Friday’s jobs report bring relief or more angst for the markets? Eurozone flash GDP and CPI numbers in focus for the Euro.

Read more

Forex MAJORS

Cryptocurrencies

Signatures