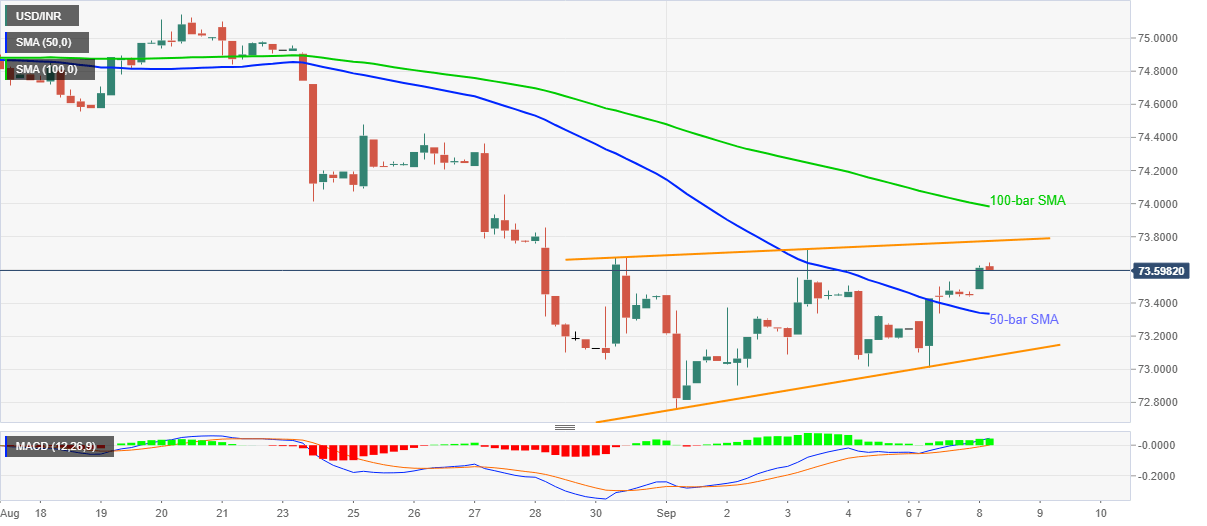
- USD/INR extends Monday’s recovery moves from 73.01 beyond 50-bar SMA.
- Beijing warns India over latest moves near LAC.
- The rising wedge’s resistance, 100-bar SMA can question the bulls.
- Further selling may wait for confirmation of the bearish chart pattern.
USD/INR takes the bids near 73.62, up 0.20% on a day, ahead of Tuesday’s European session. The Indian rupee recently gained after China accuses New Delhi of fire shots near the Line of Actual Control (LAC).
The Asian majors have been at loggerheads off-late amid the border disputes. The geopolitical tension is gaining momentum as the friendship between US President Donald Trump and Indian Prime Minister Narendra Modi seems to push the dragon nation out of the world’s bright side. As a result, Washington and New Delhi are turning the heat of anti-trade measures over the Xi Jinping-led country.
Read: China accuses India of serious military provocation - CCTV
In doing so, the pair crosses 50-bar SMA amid bullish MACD, which in turn suggests further advances to an upward sloping trend line from August 31, forming part of the rising wedge bearish pattern, around 73.78.
Even so, the bulls are less likely to remain for long as 100-bar SMA near 74.00 stands tall to challenge the quote additional rise.
Meanwhile, the pair’s declines below the 50-bar SMA level of 73.33 will push the sellers to watch over the rising wedge’s support line, at 73.07 as a break of which can magnify the selling pressure towards the early-2020 top surrounding 72.20.
Though, 73.00 round-figures and the monthly low near 72.76 may offer intermediate halts during the heavy fall.
USD/INR four-hour chart
Trend: Pullback expected
Information on these pages contains forward-looking statements that involve risks and uncertainties. Markets and instruments profiled on this page are for informational purposes only and should not in any way come across as a recommendation to buy or sell in these assets. You should do your own thorough research before making any investment decisions. FXStreet does not in any way guarantee that this information is free from mistakes, errors, or material misstatements. It also does not guarantee that this information is of a timely nature. Investing in Open Markets involves a great deal of risk, including the loss of all or a portion of your investment, as well as emotional distress. All risks, losses and costs associated with investing, including total loss of principal, are your responsibility. The views and opinions expressed in this article are those of the authors and do not necessarily reflect the official policy or position of FXStreet nor its advertisers. The author will not be held responsible for information that is found at the end of links posted on this page.
If not otherwise explicitly mentioned in the body of the article, at the time of writing, the author has no position in any stock mentioned in this article and no business relationship with any company mentioned. The author has not received compensation for writing this article, other than from FXStreet.
FXStreet and the author do not provide personalized recommendations. The author makes no representations as to the accuracy, completeness, or suitability of this information. FXStreet and the author will not be liable for any errors, omissions or any losses, injuries or damages arising from this information and its display or use. Errors and omissions excepted.
The author and FXStreet are not registered investment advisors and nothing in this article is intended to be investment advice.
Recommended content
Editors’ Picks
EUR/USD holds above 1.0700 ahead of key US data

EUR/USD trades in a tight range above 1.0700 in the early European session on Friday. The US Dollar struggles to gather strength ahead of key PCE Price Index data, the Fed's preferred gauge of inflation, and helps the pair hold its ground.
USD/JPY stays above 156.00 after BoJ Governor Ueda's comments

USD/JPY holds above 156.00 after surging above this level with the initial reaction to the Bank of Japan's decision to leave the policy settings unchanged. BoJ Governor said weak Yen was not impacting prices but added that they will watch FX developments closely.
Gold price oscillates in a range as the focus remains glued to the US PCE Price Index

Gold price struggles to attract any meaningful buyers amid the emergence of fresh USD buying. Bets that the Fed will keep rates higher for longer amid sticky inflation help revive the USD demand.
Sei Price Prediction: SEI is in the zone of interest after a 10% leap

Sei price has been in recovery mode for almost ten days now, following a fall of almost 65% beginning in mid-March. While the SEI bulls continue to show strength, the uptrend could prove premature as massive bearish sentiment hovers above the altcoin’s price.
US core PCE inflation set to signal firm price pressures as markets delay Federal Reserve rate cut bets

The core PCE Price Index, which excludes volatile food and energy prices, is seen as the more influential measure of inflation in terms of Fed positioning. The index is forecast to rise 0.3% on a monthly basis in March, matching February’s increase.