USD/INR Price Analysis: Indian rupee looks south as per the weekly chart

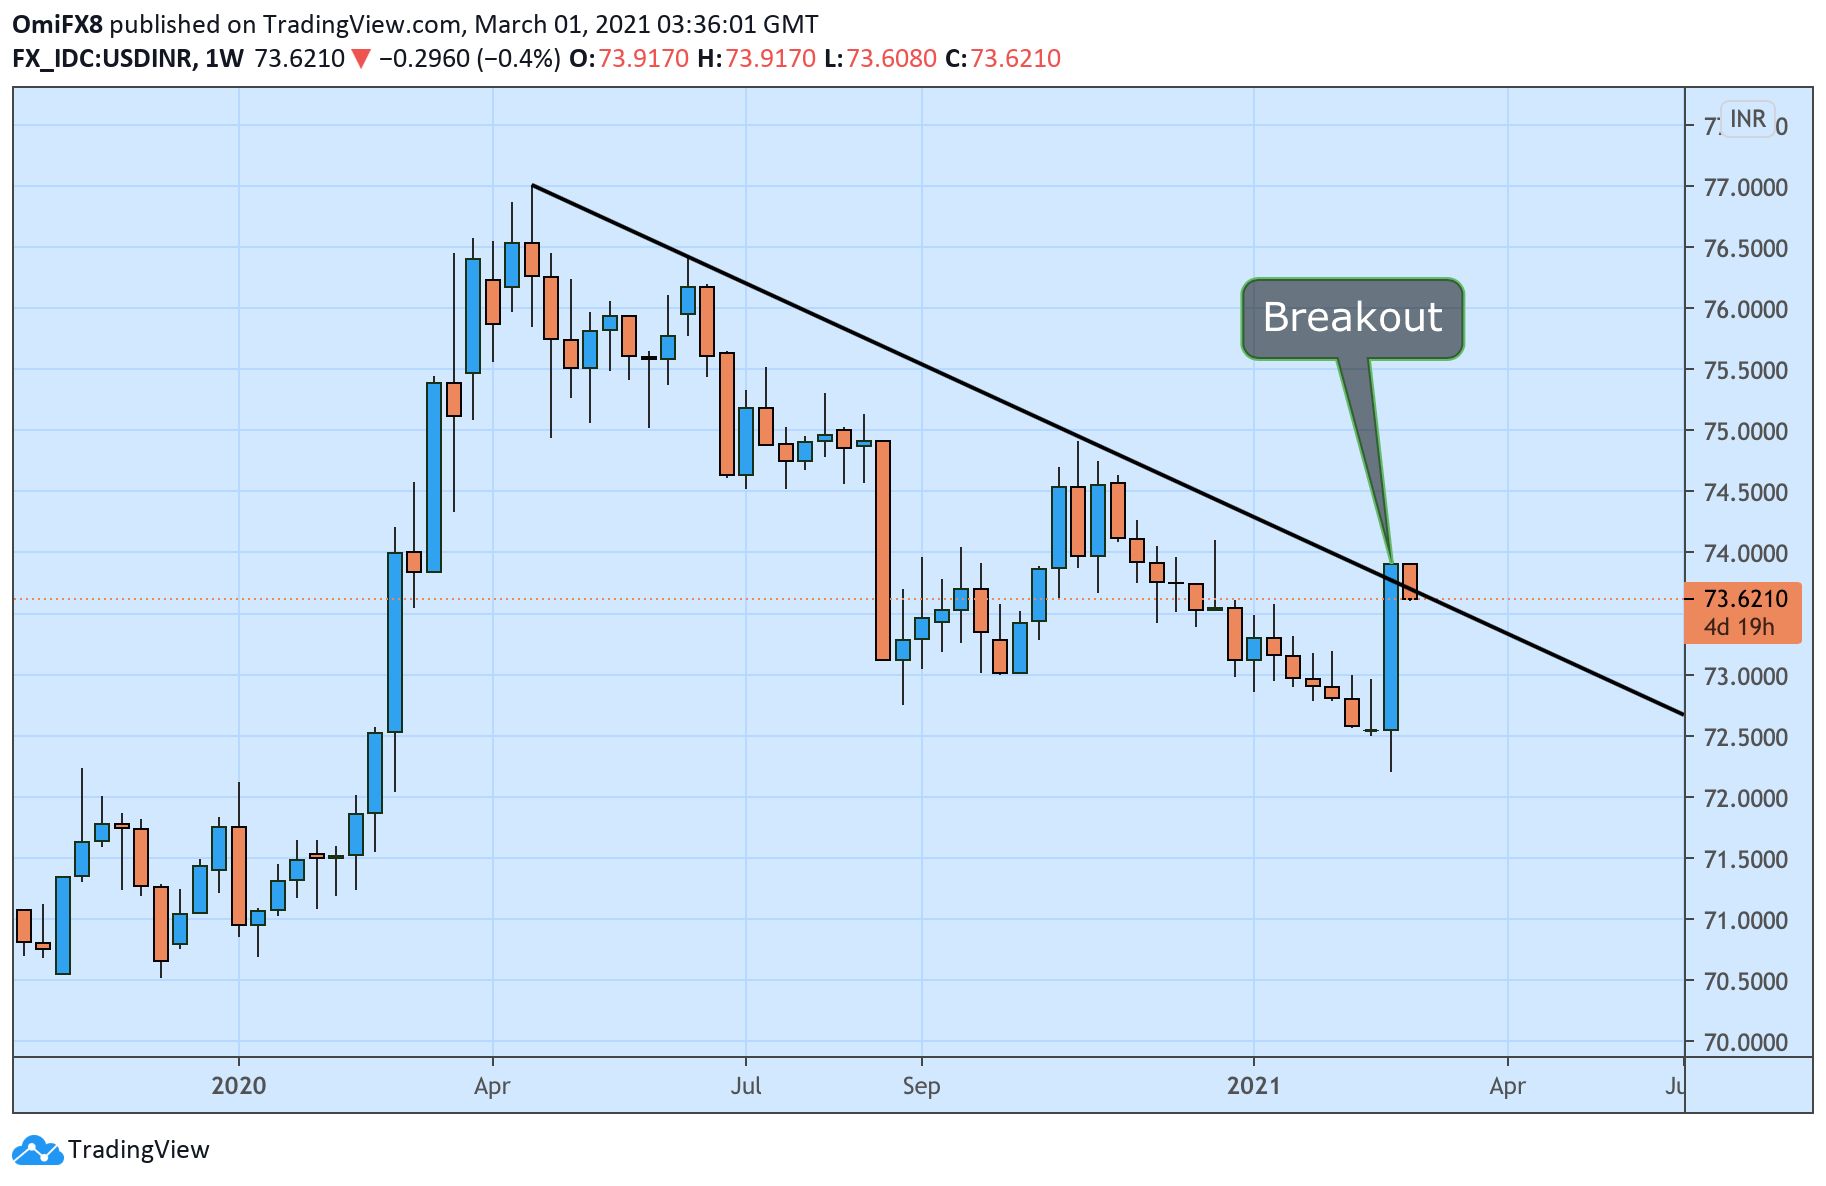
USD/INR jumped 1.88% last week – the biggest single-week percentage gain since March 2020 – confirming an upside break of the trendline falling from April 2020 and June 2020 highs.
The breakout indicates the multi-month long bearish trend has ended, and the bulls have regained control. As such, the November high of 74.9140 stands exposed.
However, a pullback could precede a rally to November highs, as markets typically shake out weak bulls before chalking out a positive follow-through to a major breakout similar to the one seen on USD/INR's weekly chart.
Acceptance under 72.21 (last week's low) is needed to invalidate the bullish bias.
Weekly chart
Trend: Bullish
Technical levels
Author

Omkar Godbole
FXStreet Contributor
Omkar Godbole, editor and analyst, joined FXStreet after four years as a research analyst at several Indian brokerage companies.


