|

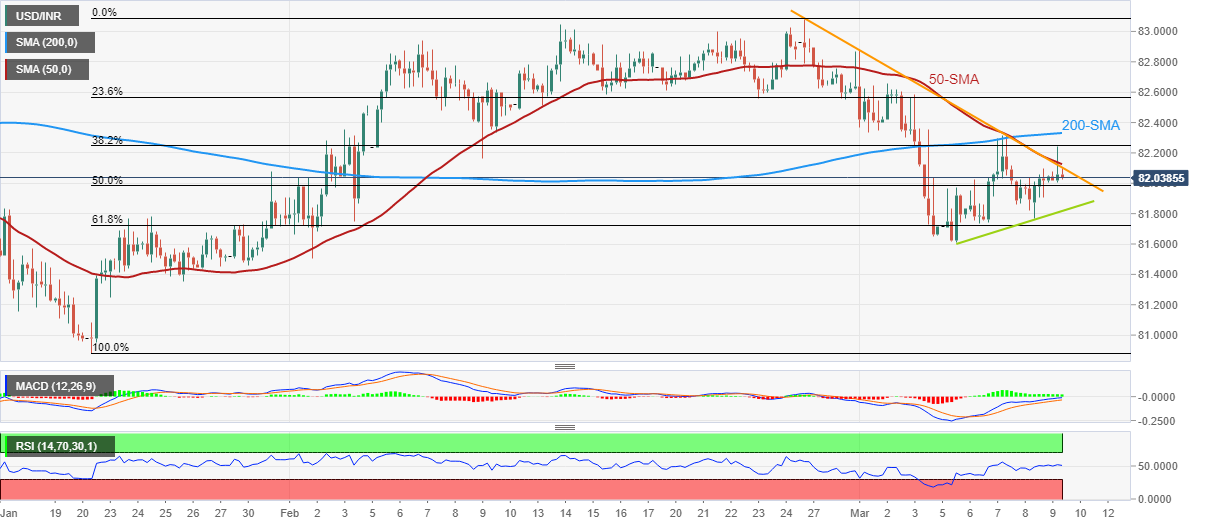
USD/INR Price Analysis: Indian Rupee jostles with 82.15 support confluence

  • USD/INR bears attack a convergence of 50-SMA, one-week-old resistance line.
  • Upbeat oscillators suggest further recovery but 200-SMA acts as additional upside filter.
  • Ascending trend line from Monday restricts immediate downside.

USD/INR struggles to extend the previous day’s recovery moves as it retreats to 82.00 round figure heading into Friday’s European session. In doing so, the Indian Rupee (INR) pair steps back from a convergence of the 50-bar Simple Moving Average (SMA) and a downward-sloping resistance line from February 27.

Even so, the bullish MACD signals and upward-sloping RSI (14), not overbought, keep USD/INR buyers hopeful of crossing the immediate 82.15 resistance confluence.

Following that, the 200-SMA level surrounding 82.35 acts as the last defense of the pair bears, a break of which could quickly propel the USD/INR prices toward the 23.6% Fibonacci retracement level of its late January-February upside, around 82.55.

It should be noted that the Indian Rupee’s weakness past 82.55 could help the USD/INR bulls to refresh the monthly high, currently around 83.10. In that case, the October 2022 peak of near 83.43 will be in focus.

On the flip side, USD/INR pullback may initially aim for the weekly support line, close to 81.80 at the latest.

However, the 61.8% Fibonacci retracement level and the monthly low, respectively near 81.70 and 81.60, could test the USD/INR bears before giving them control.

Overall, USD/INR is likely to recover but the road to the upside is long and bumpy.

USD/INR: Four-hour chart

Trend: Further upside expected

Additional important levels

Overview
Today last price82.0255
Today Daily Change-0.0281
Today Daily Change %-0.03%
Today daily open82.0536
 
Trends
Daily SMA2082.4989
Daily SMA5082.1629
Daily SMA10082.1302
Daily SMA20080.9667
 
Levels
Previous Daily High82.0946
Previous Daily Low81.7675
Previous Weekly High83.082
Previous Weekly Low81.6486
Previous Monthly High83.082
Previous Monthly Low81.5032
Daily Fibonacci 38.2%81.9697
Daily Fibonacci 61.8%81.8925
Daily Pivot Point S181.8491
Daily Pivot Point S281.6447
Daily Pivot Point S381.522
Daily Pivot Point R182.1763
Daily Pivot Point R282.299
Daily Pivot Point R382.5034

Author

Anil Panchal

Anil Panchal

FXStreet

Anil Panchal has nearly 15 years of experience in tracking financial markets. With a keen interest in macroeconomics, Anil aptly tracks global news/updates and stays well-informed about the global financial moves and their implications.

More from Anil Panchal
Share:

Editor's Picks

EUR/USD stays weak near 1.1850 after dismal German ZEW data

EUR/USD remains in the red near 1.1850 in the European session on Tuesday. A broad US Dollar bullish consolidation combined with a softer risk tone keep the pair undermined alongside downbeat German ZEW sentiment readings for February. 

GBP/USD holds losees near 1.3600 after weak UK jobs report

GBP/USD is holding moderate losses near the 1.3600 level in Tuesday's European trading. The United Kingdom employment data suggested worsening labor market conditions, bolstering bets for a BoE interest rate cut next month. This narrative keeps the Pound Sterling under bearish pressure. 

Gold pares intraday losses; keeps the red above $4,900 amid receding safe-haven demand

Gold (XAU/USD) attracts some follow-through selling for the second straight day and dives to over a one-week low, around the $4,858 area, heading into the European session on Tuesday. 

Canada CPI expected to show sticky inflation in January, still above BoC’s target

Economists see the headline CPI rising by 2.4% in a year to January, still above the BoC’s target and matching December’s increase. On a monthly basis, prices are expected to rise by 0.1%.

UK jobs market weakens, bolstering rate cut hopes

In the UK, the latest jobs report made for difficult reading. Nonetheless, this represents yet another reminder for the Bank of England that they need to act swiftly given the collapse in inflation expected over the coming months. 

Stellar mixed sentiment caps recovery

Stellar price remains under pressure, trading at $0.170 on Tuesday after failing to close above the key resistance on Sunday. The derivatives metric supports the bearish sentiment, with XLM’s short bets rising among traders and funding rates turning negative.