USD/JPY Price Forecast: Falls toward 156.00 after breaking below nine-day EMA
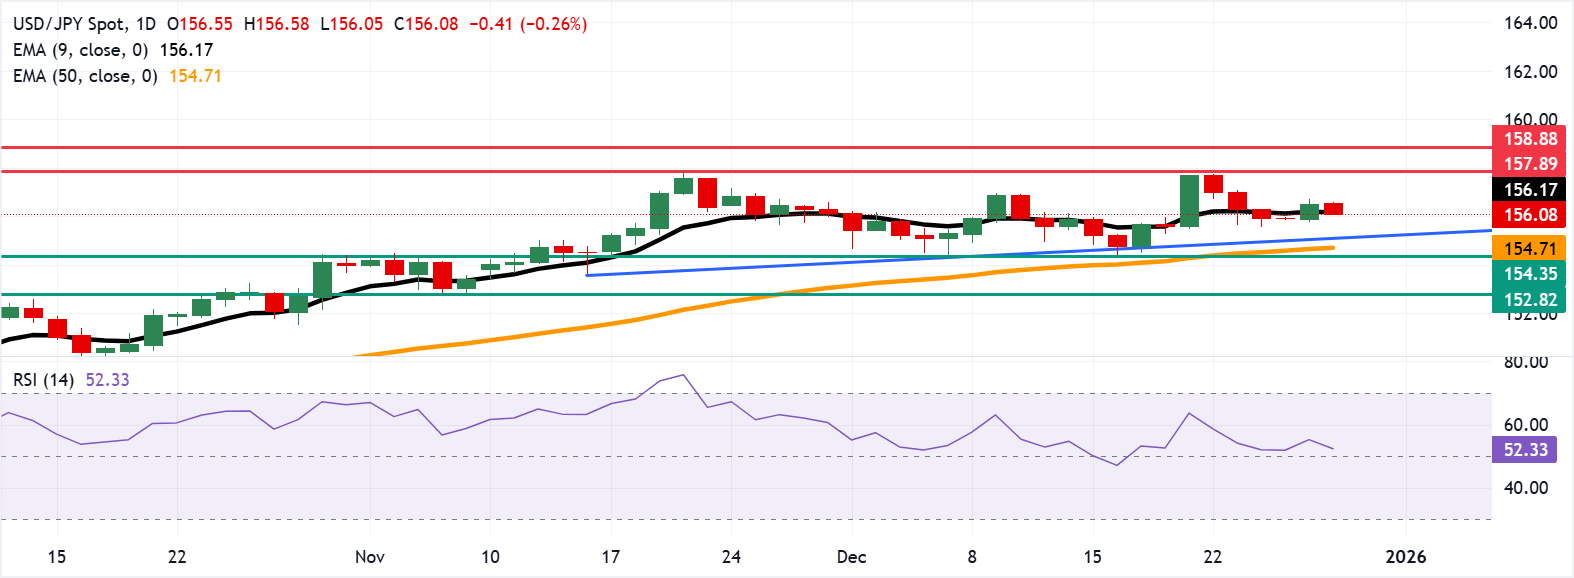
- USD/JPY may rebound toward the immediate barrier at the nine-day EMA of 156.19.
- The 14-day Relative Strength Index has eased to a neutral 52.80 from recent higher levels.
- The initial support lies at the upside trendline around 155.10.

USD/JPY retraces its recent gains registered in the previous session, trading around 156.10 during the European hours on Monday. On the daily chart, technical analysis indicates the 14-day Relative Strength Index (RSI) sitting at 52.80 (neutral) after easing from recent readings. A turn higher in RSI would strengthen bullish conviction, while a drift toward 50 would keep range-bound conditions in place.
The 50-day Exponential Moving Average (EMA) rises, supporting the broader uptrend. The nine-day EMA is flat with price hovering around it, pointing to near-term consolidation. The setup keeps a modest bullish bias while above the rising 50-day EMA.
Upside momentum would re-accelerate on a daily close above the immediate barrier at the nine-day EMA of 156.19, opening the path toward the next resistance around the 11-month high of 157.90. Further advances would support the USD/JPY pair to test the 158.88, the highest since July 2024.
On the downside, a rejection at the nine-day EMA and a break beneath the nearest support at the upside trendline around 155.10 would shift focus to the secondary floor and risk a deeper pullback toward the 50-day EMA at 154.72.
Japanese Yen Price Today
The table below shows the percentage change of Japanese Yen (JPY) against listed major currencies today. Japanese Yen was the strongest against the New Zealand Dollar.
| USD | EUR | GBP | JPY | CAD | AUD | NZD | CHF | |
|---|---|---|---|---|---|---|---|---|
| USD | -0.00% | 0.14% | -0.20% | 0.18% | 0.18% | 0.37% | -0.02% | |
| EUR | 0.00% | 0.15% | -0.18% | 0.19% | 0.19% | 0.35% | -0.02% | |
| GBP | -0.14% | -0.15% | -0.32% | 0.04% | 0.03% | 0.22% | -0.17% | |
| JPY | 0.20% | 0.18% | 0.32% | 0.36% | 0.38% | 0.55% | 0.11% | |
| CAD | -0.18% | -0.19% | -0.04% | -0.36% | 0.00% | 0.19% | -0.21% | |
| AUD | -0.18% | -0.19% | -0.03% | -0.38% | -0.00% | 0.18% | -0.21% | |
| NZD | -0.37% | -0.35% | -0.22% | -0.55% | -0.19% | -0.18% | -0.39% | |
| CHF | 0.02% | 0.02% | 0.17% | -0.11% | 0.21% | 0.21% | 0.39% |
The heat map shows percentage changes of major currencies against each other. The base currency is picked from the left column, while the quote currency is picked from the top row. For example, if you pick the Japanese Yen from the left column and move along the horizontal line to the US Dollar, the percentage change displayed in the box will represent JPY (base)/USD (quote).
(The technical analysis of this story was written with the help of an AI tool.)
Author

Akhtar Faruqui
FXStreet
Akhtar Faruqui is a Forex Analyst based in New Delhi, India. With a keen eye for market trends and a passion for dissecting complex financial dynamics, he is dedicated to delivering accurate and insightful Forex news and analysis.

















