USD/INR Price Analysis: Indian Rupee buyers need to keep the reins past 82.80


  • USD/INR takes offers to refresh intraday low, reverses from five-week high.
  • Failure to cross five-month-old resistance line joins overbought RSI to lure Indian Rupee buyers.
  • Descending trend line from October 2022, bullish MACD signals prod bears.

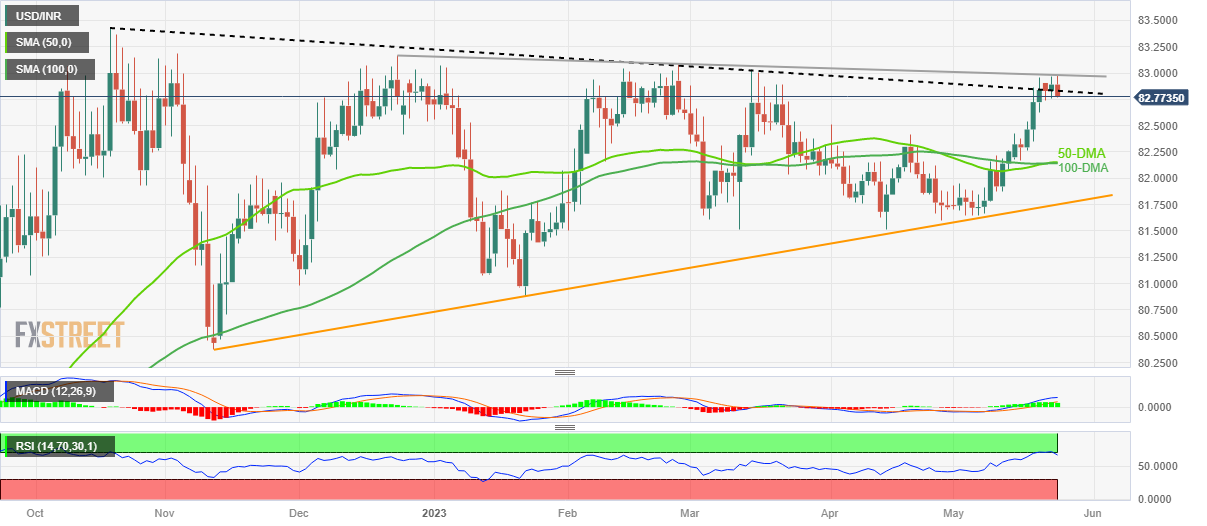
USD/INR renews intraday bottom around 82.80 while extending pullback from a five-week high during early Wednesday. In doing so, the pair registers failure to cross the yearly resistance line amid the overbought RSI.

However, the bullish MACD signals and the resistance-turned-support line stretched from late 2022, close to 82.80 by the press time, challenge the Indian Rupee (INR) buyers of late.

Should the quote manages to provide a daily close below the 82.80 level, it can quickly fall to the previous monthly high of near 82.50 ahead of targeting the late April swing high of around 82.40.

Though, a convergence of the 50-DMA and 100-DMA, around 82.15, appears a tough nut to crack for the USD/INR bears afterward.

Even if the quote breaks the 82.15 level, an upward-sloping support line from November 2022, close to 81.75 at the latest, can act as the last defense of the USD/INR buyers.

On the contrary, a daily closing beyond the falling resistance line from the last December, near the 83.00 round figure, won’t hesitate to challenge the record high marked in 2022 around 83.40.

It’s worth noting that the late 2022 peaks of near 83.20 may offer intermediate halts during the quote’s upside past 83.00.

USD/INR: Daily chart

Trend: Further downside expected

USD/INR

Overview
Today last price 82.8045
Today Daily Change -0.0856
Today Daily Change % -0.10
Today daily open 82.8901
 
Trends
Daily SMA20 82.1282
Daily SMA50 82.1512
Daily SMA100 82.1424
Daily SMA200 81.8118
 
Levels
Previous Daily High 82.967
Previous Daily Low 82.7575
Previous Weekly High 82.9554
Previous Weekly Low 82.1655
Previous Monthly High 82.5092
Previous Monthly Low 81.485
Daily Fibonacci 38.2% 82.887
Daily Fibonacci 61.8% 82.8375
Daily Pivot Point S1 82.776
Daily Pivot Point S2 82.662
Daily Pivot Point S3 82.5665
Daily Pivot Point R1 82.9856
Daily Pivot Point R2 83.0811
Daily Pivot Point R3 83.1952


Share: Feed news

Information on these pages contains forward-looking statements that involve risks and uncertainties. Markets and instruments profiled on this page are for informational purposes only and should not in any way come across as a recommendation to buy or sell in these assets. You should do your own thorough research before making any investment decisions. FXStreet does not in any way guarantee that this information is free from mistakes, errors, or material misstatements. It also does not guarantee that this information is of a timely nature. Investing in Open Markets involves a great deal of risk, including the loss of all or a portion of your investment, as well as emotional distress. All risks, losses and costs associated with investing, including total loss of principal, are your responsibility. The views and opinions expressed in this article are those of the authors and do not necessarily reflect the official policy or position of FXStreet nor its advertisers. The author will not be held responsible for information that is found at the end of links posted on this page.

If not otherwise explicitly mentioned in the body of the article, at the time of writing, the author has no position in any stock mentioned in this article and no business relationship with any company mentioned. The author has not received compensation for writing this article, other than from FXStreet.

FXStreet and the author do not provide personalized recommendations. The author makes no representations as to the accuracy, completeness, or suitability of this information. FXStreet and the author will not be liable for any errors, omissions or any losses, injuries or damages arising from this information and its display or use. Errors and omissions excepted.

The author and FXStreet are not registered investment advisors and nothing in this article is intended to be investment advice.

Recommended content


Recommended content

Editors’ Picks

EUR/USD extends sideways grind below 1.0900

EUR/USD extends sideways grind below 1.0900

EUR/USD stays in a consolidation phase below 1.0900 following the previous week's rally. In the absence of high-tier data releases, the US Dollar stays resilient against its rivals as investors scrutinize comments from central bank officials. 

EUR/USD News

Gold retreated from record highs, maintains the upward bias

Gold retreated from record highs, maintains the upward bias

Gold rose sharply at the beginning of the week on escalating geopolitical tensions and touched a new all-time high of $2,450. With market mood improving modestly, XAU/USD erases a majority of its daily gains but manages to hold above $2,400.

Gold News

GBP/USD holds steady near 1.2700, Fedspeak in focus

GBP/USD holds steady near 1.2700, Fedspeak in focus

GBP/USD fluctuates in a narrow channel near 1.2700 on the first trading day of the week. The cautious market stance helps the US Dollar hold its ground, while market participants assess remarks from central bank officials ahead of this week's key events.

GBP/USD News

Ripple stays above $0.50 on Monday as firm backs research on blockchain and quantum computing

Ripple stays above $0.50 on Monday as firm backs research on blockchain and quantum computing

XRP price holds steady above the $0.50 key support level and edges higher on Monday, trading at 0.5130 and rising 0.70% in the day at the time of writing.

Read more

Week ahead: Nvidia results and UK CPI falling back to target

Week ahead: Nvidia results and UK CPI falling back to target

What a week for investors. The Dow Jones reached a record high and closed last week above 40,000, for the first time ever. This is a major bullish signal even though gains for global stocks were fairly modest on Friday, and European stocks closed lower. 

Read more

Forex MAJORS

Cryptocurrencies

Signatures