USD/CNH Price Analysis: Retreats from weekly hurdle on firmer China CPI


  • USD/CNH extends pullback from 19-month high on strong China inflation data.
  • China CPI rose 2.1%, PPI grew 8.0%, both figures crossed market consensus.
  • Sluggish RSI, a convergence of 100-HMA and short-term rising trend line challenge bears.

USD/CNH justifies strong-than-expected China inflation data by reversing from the intraday high during Wednesday’s Asian session. That said, the quote takes offers to renew daily low around 6.7400 by the press time.

China’s Consumer Price Index (CPI) rose past 1.8% market consensus to 2.1% YoY whereas the Producer Price Index (PPI) crossed 7.7% expectations with the 8.0% yearly figures.

It’s worth noting that the offshore Chinese currency (CNH) pair rallied to the highest since October 2020 before retreating from 6.7765 during the early week.

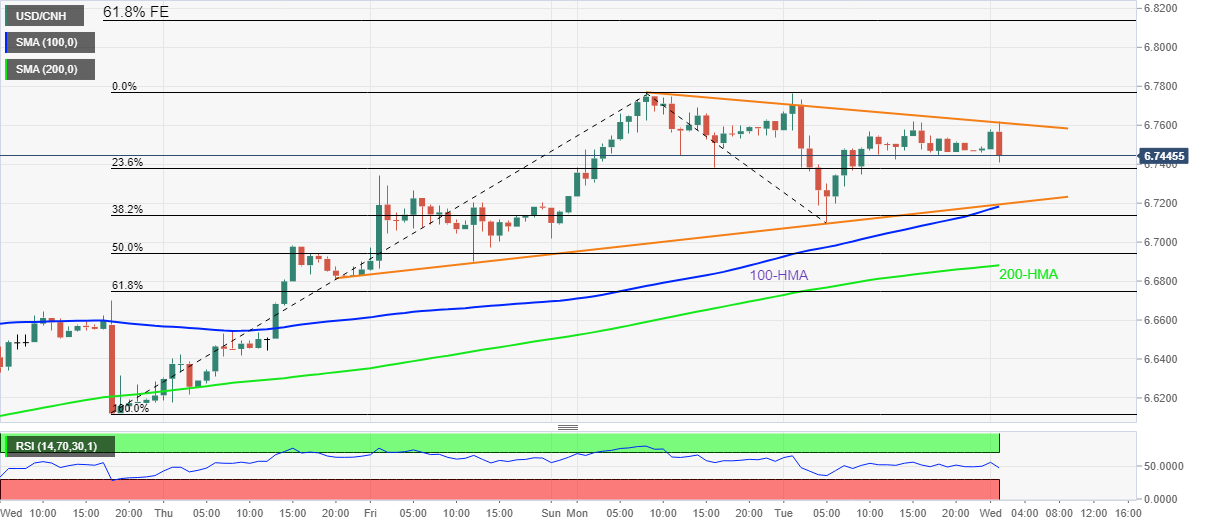
Considering the upbeat inflation numbers and the pair’s failures to refresh the multi-day high, the USD/CNH prices are likely to decline towards the immediate support, namely May 06 peak surrounding 6.7345.

However, the 100-HMA and ascending support line from May 05 portrays 6.7180 as a tough nut to crack for the pair sellers. Also acting as important support is the 200-HMA level, near 6.6880 by the press time.

Alternatively, recovery moves need to cross the immediate resistance line, at 6.7615, before challenging the multi-day high flashed on Monday around 6.7765.

In a case where USD/CNH bulls keep reins past 6.7765, the 61.8% Fibonacci Expansion (FE) of May 04-10 moves, near 6.8120, will be on their radars.

USD/CNH: Hourly chart

Trend: Pullback expected

Additional important levels

Overview
Today last price 6.7472
Today Daily Change -0.0038
Today Daily Change % -0.06%
Today daily open 6.751
 
Trends
Daily SMA20 6.5649
Daily SMA50 6.4432
Daily SMA100 6.3993
Daily SMA200 6.4127
 
Levels
Previous Daily High 6.776
Previous Daily Low 6.7098
Previous Weekly High 6.7342
Previous Weekly Low 6.6116
Previous Monthly High 6.694
Previous Monthly Low 6.3512
Daily Fibonacci 38.2% 6.7351
Daily Fibonacci 61.8% 6.7508
Daily Pivot Point S1 6.7152
Daily Pivot Point S2 6.6794
Daily Pivot Point S3 6.649
Daily Pivot Point R1 6.7814
Daily Pivot Point R2 6.8118
Daily Pivot Point R3 6.8476


Share: Feed news

Information on these pages contains forward-looking statements that involve risks and uncertainties. Markets and instruments profiled on this page are for informational purposes only and should not in any way come across as a recommendation to buy or sell in these assets. You should do your own thorough research before making any investment decisions. FXStreet does not in any way guarantee that this information is free from mistakes, errors, or material misstatements. It also does not guarantee that this information is of a timely nature. Investing in Open Markets involves a great deal of risk, including the loss of all or a portion of your investment, as well as emotional distress. All risks, losses and costs associated with investing, including total loss of principal, are your responsibility. The views and opinions expressed in this article are those of the authors and do not necessarily reflect the official policy or position of FXStreet nor its advertisers. The author will not be held responsible for information that is found at the end of links posted on this page.

If not otherwise explicitly mentioned in the body of the article, at the time of writing, the author has no position in any stock mentioned in this article and no business relationship with any company mentioned. The author has not received compensation for writing this article, other than from FXStreet.

FXStreet and the author do not provide personalized recommendations. The author makes no representations as to the accuracy, completeness, or suitability of this information. FXStreet and the author will not be liable for any errors, omissions or any losses, injuries or damages arising from this information and its display or use. Errors and omissions excepted.

The author and FXStreet are not registered investment advisors and nothing in this article is intended to be investment advice.

Recommended content


Recommended content

Editors’ Picks

EUR/USD clings to gains above 1.0750 after US data

EUR/USD clings to gains above 1.0750 after US data

EUR/USD manages to hold in positive territory above 1.0750 despite retreating from the fresh multi-week high it set above 1.0800 earlier in the day. The US Dollar struggles to find demand following the weaker-than-expected NFP data.

EUR/USD News

GBP/USD declines below 1.2550 following NFP-inspired upsurge

GBP/USD declines below 1.2550 following NFP-inspired upsurge

GBP/USD struggles to preserve its bullish momentum and trades below 1.2550 in the American session. Earlier in the day, the disappointing April jobs report from the US triggered a USD selloff and allowed the pair to reach multi-week highs above 1.2600.

GBP/USD News

Gold struggles to hold above $2,300 despite falling US yields

Gold struggles to hold above $2,300 despite falling US yields

Gold stays on the back foot below $2,300 in the American session on Friday. The benchmark 10-year US Treasury bond yield stays in negative territory below 4.6% after weak US data but the improving risk mood doesn't allow XAU/USD to gain traction.

Gold News

Bitcoin Weekly Forecast: Should you buy BTC here? Premium

Bitcoin Weekly Forecast: Should you buy BTC here?

Bitcoin (BTC) price shows signs of a potential reversal but lacks confirmation, which has divided the investor community into two – those who are buying the dips and those who are expecting a further correction.

Read more

Week ahead – BoE and RBA decisions headline a calm week

Week ahead – BoE and RBA decisions headline a calm week

Bank of England meets on Thursday, unlikely to signal rate cuts. Reserve Bank of Australia could maintain a higher-for-longer stance. Elsewhere, Bank of Japan releases summary of opinions.

Read more

Forex MAJORS

Cryptocurrencies

Signatures