USD/CNH Price Analysis: Pierces 6.7600 key hurdle on China inflation miss


  • USD/CNH snaps two-day downtrend after softer-than-expected China CPI, PPI for July.
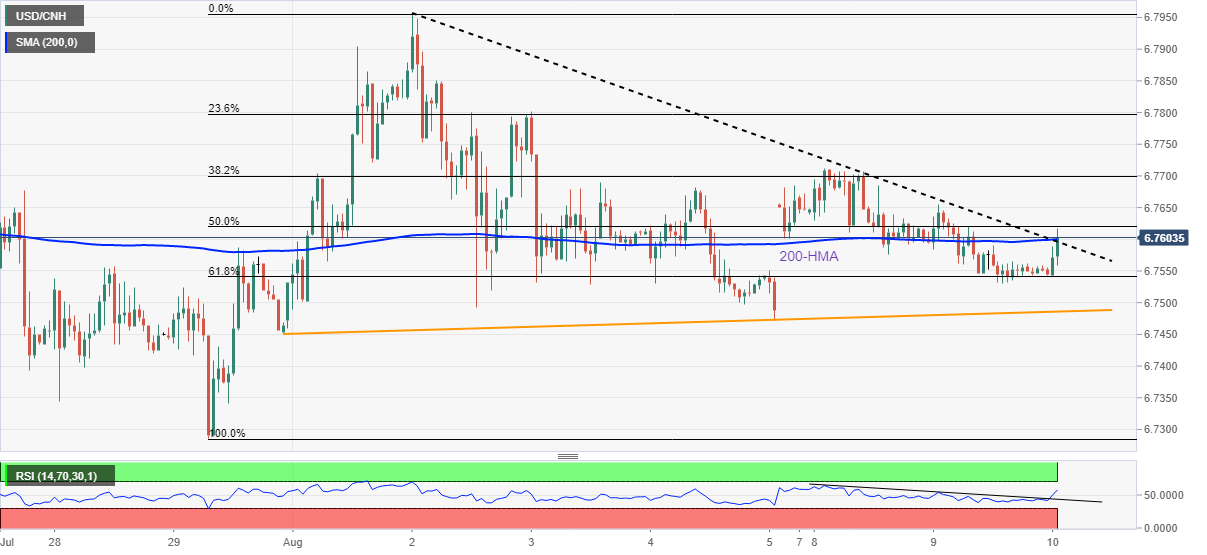
  • Bulls pierced weekly resistance line, 200-HMA after data, sustained break of 6.7600 awaited for further upside.
  • 61.8% Fibonacci retracement level, ascending trend line from July 31 restrict immediate downside.

USD/CNH remains firmer around the daily top after China flashed downbeat inflation numbers for July. That said, the offshore Chinese yuan (CNH) pair marks the first daily gains in three while grinding higher around 6.7600.

China’s headline Consumer Price Index (CPI) eases to 2.7% YoY in July versus 2.9% expected and 2.5% prior. Further, the Producer Price Index (PPI) dropped to 4.2% compared to 8.0% market forecasts and 6.1% previous readings.

Following the data, the USD/CNH bulls crossed the 6.7600 key hurdle comprising the 200-HMA and a one-week-old descending resistance line, before retreating from 6.7600.

However, a pick-up in the RSI (14) and the quote’s successful trading above the 61.8% Fibonacci retracement of July 29 to August 02 upside, near 6.7540, keeps the USD/CNH buyers hopeful.

That said, the weekly top surrounding 6.7710 is likely luring the pair buyers of late, a break of which could direct the north-run towards the monthly peak of 6.7955 and then to the 6.8000 threshold.

Meanwhile, pullback moves remain elusive beyond the 61.8% gold ratio near 6.7540. Also acting as a downside filter is the seven-day-long support line close to 6.7485.

In a case where USD/CNH drops below 6.7485, the odds of its slump to the late July low near 6.7285 can’t be ruled out

USD/CNH: Hourly chart

Trend: Further upside expected

Additional important levels

Overview
Today last price 6.7598
Today Daily Change 0.0052
Today Daily Change % 0.08%
Today daily open 6.7546
 
Trends
Daily SMA20 6.7583
Daily SMA50 6.7234
Daily SMA100 6.641
Daily SMA200 6.5025
 
Levels
Previous Daily High 6.7654
Previous Daily Low 6.753
Previous Weekly High 6.7956
Previous Weekly Low 6.7452
Previous Monthly High 6.792
Previous Monthly Low 6.6804
Daily Fibonacci 38.2% 6.7578
Daily Fibonacci 61.8% 6.7607
Daily Pivot Point S1 6.7499
Daily Pivot Point S2 6.7453
Daily Pivot Point S3 6.7375
Daily Pivot Point R1 6.7623
Daily Pivot Point R2 6.7701
Daily Pivot Point R3 6.7747


Share: Feed news

Information on these pages contains forward-looking statements that involve risks and uncertainties. Markets and instruments profiled on this page are for informational purposes only and should not in any way come across as a recommendation to buy or sell in these assets. You should do your own thorough research before making any investment decisions. FXStreet does not in any way guarantee that this information is free from mistakes, errors, or material misstatements. It also does not guarantee that this information is of a timely nature. Investing in Open Markets involves a great deal of risk, including the loss of all or a portion of your investment, as well as emotional distress. All risks, losses and costs associated with investing, including total loss of principal, are your responsibility. The views and opinions expressed in this article are those of the authors and do not necessarily reflect the official policy or position of FXStreet nor its advertisers. The author will not be held responsible for information that is found at the end of links posted on this page.

If not otherwise explicitly mentioned in the body of the article, at the time of writing, the author has no position in any stock mentioned in this article and no business relationship with any company mentioned. The author has not received compensation for writing this article, other than from FXStreet.

FXStreet and the author do not provide personalized recommendations. The author makes no representations as to the accuracy, completeness, or suitability of this information. FXStreet and the author will not be liable for any errors, omissions or any losses, injuries or damages arising from this information and its display or use. Errors and omissions excepted.

The author and FXStreet are not registered investment advisors and nothing in this article is intended to be investment advice.

Recommended content


Recommended content

Editors’ Picks

EUR/USD trades with negative bias, holds above 1.0700 as traders await US PCE Price Index

EUR/USD trades with negative bias, holds above 1.0700 as traders await US PCE Price Index

EUR/USD edges lower during the Asian session on Friday and moves away from a two-week high, around the 1.0740 area touched the previous day. Spot prices trade around the 1.0725-1.0720 region and remain at the mercy of the US Dollar price dynamics ahead of the crucial US data.

EUR/USD News

USD/JPY jumps above 156.00 on BoJ's steady policy

USD/JPY jumps above 156.00 on BoJ's steady policy

USD/JPY has come under intense buying pressure, surging past 156.00 after the Bank of Japan kept the key rate unchanged but tweaked its policy statement. The BoJ maintained its fiscal year 2024 and 2025 core inflation forecasts, disappointing the Japanese Yen buyers. 

USD/JPY News

Gold price flatlines as traders look to US PCE Price Index for some meaningful impetus

Gold price flatlines as traders look to US PCE Price Index for some meaningful impetus

Gold price lacks any firm intraday direction and is influenced by a combination of diverging forces. The weaker US GDP print and a rise in US inflation benefit the metal amid subdued USD demand. Hawkish Fed expectations cap the upside as traders await the release of the US PCE Price Index.

Gold News

Sei Price Prediction: SEI is in the zone of interest after a 10% leap

Sei Price Prediction: SEI is in the zone of interest after a 10% leap

Sei price has been in recovery mode for almost ten days now, following a fall of almost 65% beginning in mid-March. While the SEI bulls continue to show strength, the uptrend could prove premature as massive bearish sentiment hovers above the altcoin’s price.

Read more

US economy: Slower growth with stronger inflation

US economy: Slower growth with stronger inflation

The US Dollar strengthened, and stocks fell after statistical data from the US. The focus was on the preliminary estimate of GDP for the first quarter. Annualised quarterly growth came in at just 1.6%, down from the 2.5% and 3.4% previously forecast.

Read more

Forex MAJORS

Cryptocurrencies

Signatures