USD/CNH Price Analysis: Eight-month-old support line, oversold RSI test bears near 6.7200


  • USD/CNH pares intraday losses around 13-day low, picking up bids of late.
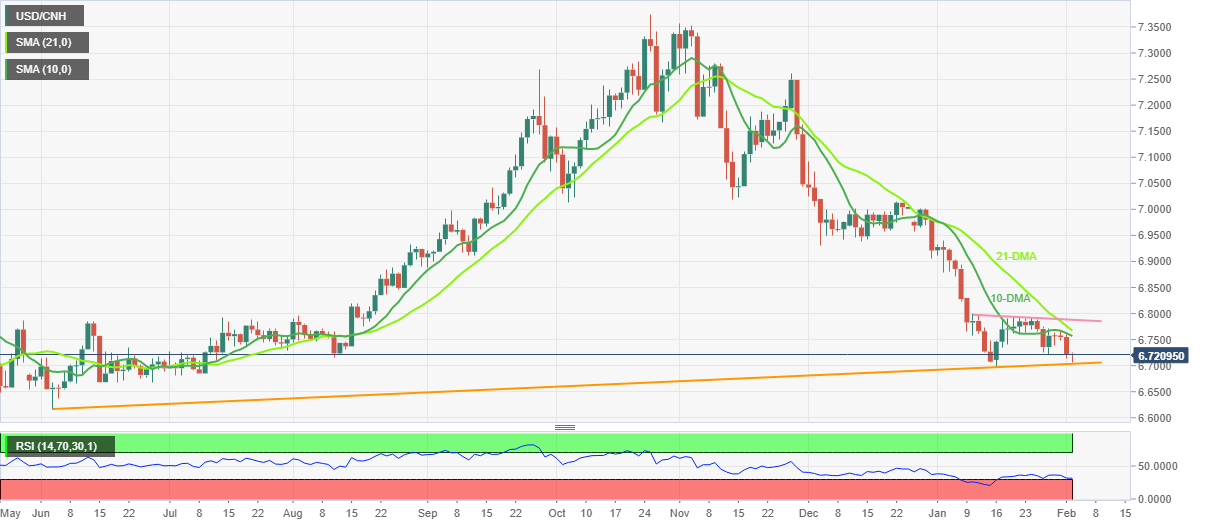
  • Ascending trend line from June 2022 appears a tough nut to crack for bears amid oversold RSI.
  • 10-DMA guards recovery moves, three-week-old resistance line challenge bulls.

USD/CNH bounces off two-week low while picking up bids to 6.7180 during early Thursday morning in Asia. In doing so, the offshore Chinese Yuan (CNH) pair also justifies the oversold RSI conditions.

However, the quote’s sustained trading below the key SMAs and a downward-sloping trend line from early January keeps the USD/CNH bears hopeful.

It’s worth noting that not only the stated support line from June 2022, close to 6.7040, but the previous monthly low of 6.6975 also challenges the pair’s further downside.

Though, a sustained break of 6.6975 won’t hesitate to visit the mid-2022 bottom surrounding 6.6170.

Meanwhile, recovery moves may initially poke the 10-DMA hurdle of 6.7570 before challenging the 21-DMA resistance of near 6.7680.

Following that, a downward sloping trend line from January 10, close to 6.7880, will be crucial for the USD/CNH buyers as a break of which could confirm a short-term upside. Even so, the 6.8000 round figure may act as a final defense of the pair sellers.

Overall, USD/CNH remains on the bear’s radar unless crossing the 6.8000 psychological magnet even if a short-term recovery appears on the table.

USD/CNH: Daily chart

Trend: Corrective bounce expected

Additional important levels

Overview
Today last price 6.7178
Today Daily Change -0.0048
Today Daily Change % -0.07%
Today daily open 6.7226
 
Trends
Daily SMA20 6.7696
Daily SMA50 6.9113
Daily SMA100 7.0395
Daily SMA200 6.9005
 
Levels
Previous Daily High 6.7604
Previous Daily Low 6.7146
Previous Weekly High 6.7916
Previous Weekly Low 6.7218
Previous Monthly High 6.9396
Previous Monthly Low 6.6976
Daily Fibonacci 38.2% 6.7321
Daily Fibonacci 61.8% 6.743
Daily Pivot Point S1 6.7046
Daily Pivot Point S2 6.6868
Daily Pivot Point S3 6.6588
Daily Pivot Point R1 6.7504
Daily Pivot Point R2 6.7784
Daily Pivot Point R3 6.7962


Share: Feed news

Information on these pages contains forward-looking statements that involve risks and uncertainties. Markets and instruments profiled on this page are for informational purposes only and should not in any way come across as a recommendation to buy or sell in these assets. You should do your own thorough research before making any investment decisions. FXStreet does not in any way guarantee that this information is free from mistakes, errors, or material misstatements. It also does not guarantee that this information is of a timely nature. Investing in Open Markets involves a great deal of risk, including the loss of all or a portion of your investment, as well as emotional distress. All risks, losses and costs associated with investing, including total loss of principal, are your responsibility. The views and opinions expressed in this article are those of the authors and do not necessarily reflect the official policy or position of FXStreet nor its advertisers. The author will not be held responsible for information that is found at the end of links posted on this page.

If not otherwise explicitly mentioned in the body of the article, at the time of writing, the author has no position in any stock mentioned in this article and no business relationship with any company mentioned. The author has not received compensation for writing this article, other than from FXStreet.

FXStreet and the author do not provide personalized recommendations. The author makes no representations as to the accuracy, completeness, or suitability of this information. FXStreet and the author will not be liable for any errors, omissions or any losses, injuries or damages arising from this information and its display or use. Errors and omissions excepted.

The author and FXStreet are not registered investment advisors and nothing in this article is intended to be investment advice.

Recommended content


Recommended content

Editors’ Picks

EUR/USD edges lower toward 1.0700 post-US PCE

EUR/USD edges lower toward 1.0700 post-US PCE

EUR/USD stays under modest bearish pressure but manages to hold above 1.0700 in the American session on Friday. The US Dollar (USD) gathers strength against its rivals after the stronger-than-forecast PCE inflation data, not allowing the pair to gain traction.

EUR/USD News

GBP/USD retreats to 1.2500 on renewed USD strength

GBP/USD retreats to 1.2500 on renewed USD strength

GBP/USD lost its traction and turned negative on the day near 1.2500. Following the stronger-than-expected PCE inflation readings from the US, the USD stays resilient and makes it difficult for the pair to gather recovery momentum.

GBP/USD News

Gold struggles to hold above $2,350 following US inflation

Gold struggles to hold above $2,350 following US inflation

Gold turned south and declined toward $2,340, erasing a large portion of its daily gains, as the USD benefited from PCE inflation data. The benchmark 10-year US yield, however, stays in negative territory and helps XAU/USD limit its losses. 

Gold News

Bitcoin Weekly Forecast: BTC’s next breakout could propel it to $80,000 Premium

Bitcoin Weekly Forecast: BTC’s next breakout could propel it to $80,000

Bitcoin’s recent price consolidation could be nearing its end as technical indicators and on-chain metrics suggest a potential upward breakout. However, this move would not be straightforward and could punish impatient investors. 

Read more

Week ahead – Hawkish risk as Fed and NFP on tap, Eurozone data eyed too

Week ahead – Hawkish risk as Fed and NFP on tap, Eurozone data eyed too

Fed meets on Wednesday as US inflation stays elevated. Will Friday’s jobs report bring relief or more angst for the markets? Eurozone flash GDP and CPI numbers in focus for the Euro.

Read more

Forex MAJORS

Cryptocurrencies

Signatures