|

USD/CHF Price Analysis: Range-bound within 0.9150-0.9200 after US jobs report

  • The USD/CHF eyes to finish the week with losses, down 1.03%.
  • Global equity indices record losses on a busy week impacted by economic data and geopolitical news.
  • USD/CHF Technical Outlook: Neutral biased, confirmed by the DMAs with an almost horizontal slope confined to a 15-pip range.

The USD/CHF climbs for the third day in the week, but it would end the week in the red following Monday’s 1% loss, which pushed the USD/CHF below the daily moving averages (DMAs). All that amid a risk-off market mood, portrayed by global equities recording losses, blamed on Ukraine-Russia’s tussles. At the time of writing, the USD/CHF is trading at 0.9188

In the meantime, the US Dollar Index, which reached a new YTD high around 98.992, aimed higher, 0.85%, sitting at 98.62, while US Treasury yields dropped amid a safe-haven bid.

US Labor market crushed expectations, green light for a Fed rate hike

On Friday, the US Department of Labor reported that the US economy added 678K new jobs in February, higher than the 400K foreseen. Also, the Unemployment Rate ticked lower, while average hourly earnings edged slightly down.

Read more: Breaking: US Non-farm Payrolls rises by 678K in February versus median forecast for 400K gain

USD/CHF Price Forecast: Technical outlook

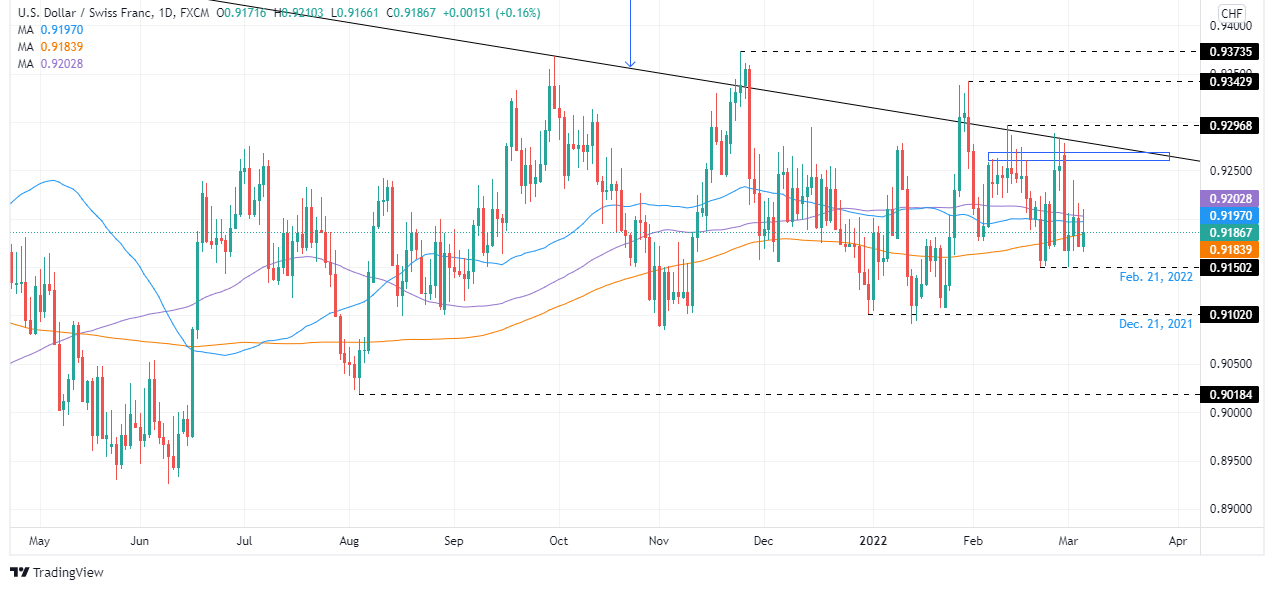
The USD/CHF is neutral biased, and one could argue that neutral-downward because the daily moving averages (DMAs) reside above the spot price. However, the almost flat slope and confined to within a 14-pip range keeps traders indecisive on which path to take.

Putting the DMA’s aside, upwards, the USD/CHF first resistance would be 0.9200. Once that level is cleared, the next supply zone would be the 0.9260-75 area and the 0.9300 mark. On the flip side, the 0.9150 February 21 daily low would be the first support, followed by December 31, 2021, daily low at 0.9102.

USD/CHF

Overview
Today last price0.9188
Today Daily Change0.0000
Today Daily Change %0.00
Today daily open0.9188
 
Trends
Daily SMA200.9223
Daily SMA500.9201
Daily SMA1000.9207
Daily SMA2000.9187
 
Levels
Previous Daily High0.9217
Previous Daily Low0.9179
Previous Weekly High0.9289
Previous Weekly Low0.915
Previous Monthly High0.9297
Previous Monthly Low0.915
Daily Fibonacci 38.2%0.9194
Daily Fibonacci 61.8%0.9202
Daily Pivot Point S10.9172
Daily Pivot Point S20.9157
Daily Pivot Point S30.9135
Daily Pivot Point R10.921
Daily Pivot Point R20.9232
Daily Pivot Point R30.9248

Author

Christian Borjon Valencia

Markets analyst, news editor, and trading instructor with over 14 years of experience across FX, commodities, US equity indices, and global macro markets.

More from Christian Borjon Valencia
Share:

Editor's Picks

AUD/USD eyes 0.7150 barrier nine-day EMA

AUD/USD inches higher after registering modest losses in the previous day, trading around 0.7130 during the Asian hours. The technical analysis of the daily chart indicates that the pair is moving sideways within the rectangle pattern, suggesting a consolidation as neither the bulls nor the bears have enough momentum to take control of the market.

USD/JPY trades below 160.00 intervention threshold; bullish bias intact

The USD/JPY pair attracts some sellers during the Asian session amid fears that authorities will step in again to prop up the Japanese Yen. Furthermore, the Israel-Lebanon truce prompts some profit-taking around the US Dollar and exerts downward pressure on the currency pair.

Gold defends 200-day SMA at $4,425, but for how long?

Gold is attempting a tepid recovery toward $4,500 early Thursday, as renewed optimism in the Mideast geopolitical front calms market nerves. This cautious optimism across Asian markets weighs on Oil prices, and diminishes the US Dollar’s safe-haven appeal, helping Gold stage a decent comeback from the weekly low of $4,424.


Hyperliquid: ETF demand, capital rotation fuel HYPE rally as Bitcoin melts

Hyperliquid price sustains an upward trend near its all-time high of $75.76 on Thursday after posting 80% gains in May, while Bitcoin (BTC) retraces below $65,000, triggering a market-wide panic.

Kevin Warsh takes the Fed helm: What it means for the US Dollar
The Federal Reserve moves away from the highly predictable "forward guidance" model of the Jerome Powell era to a new “Kevin Warsh environment”, characterized by less communication, more policy surprises, and an increased focus on the Fed's complex balance sheet.
Recession on paper: What really moves the Canadian Loonie now?

Statistics Canada handed the headline writers a gift and the analysts a headache. Real GDP shrank 0.1% on an annualized basis in the first quarter, and with the fourth quarter of 2025 revised down to a 1.0% contraction, that is two negative quarters in a row, the textbook definition of a technical recession and Canada's first since the pandemic.