- USD/CHF is almost flat during the week, with minimal gains of 0.06%.
- The Fed and the Swiss National Bank (SNB) monetary policy meetings are looming, keeping the pair range-bound.
- Short term, the USD/CHF could fall under the 0.9600 mark.
USD/CHF ended Tuesday’s trading session almost flat, with a minimal 0.01% gain, courtesy of broad US dollar strength across the board. Nevertheless, as the Asian Pacific session begins, the USD/CHF is trading at 0.9646, slightly below its opening price by 0.02%, ahead of the Fed and the Swiss National Bank monetary policy decisions.
USD/CHF Price Analysis: Technical outlook
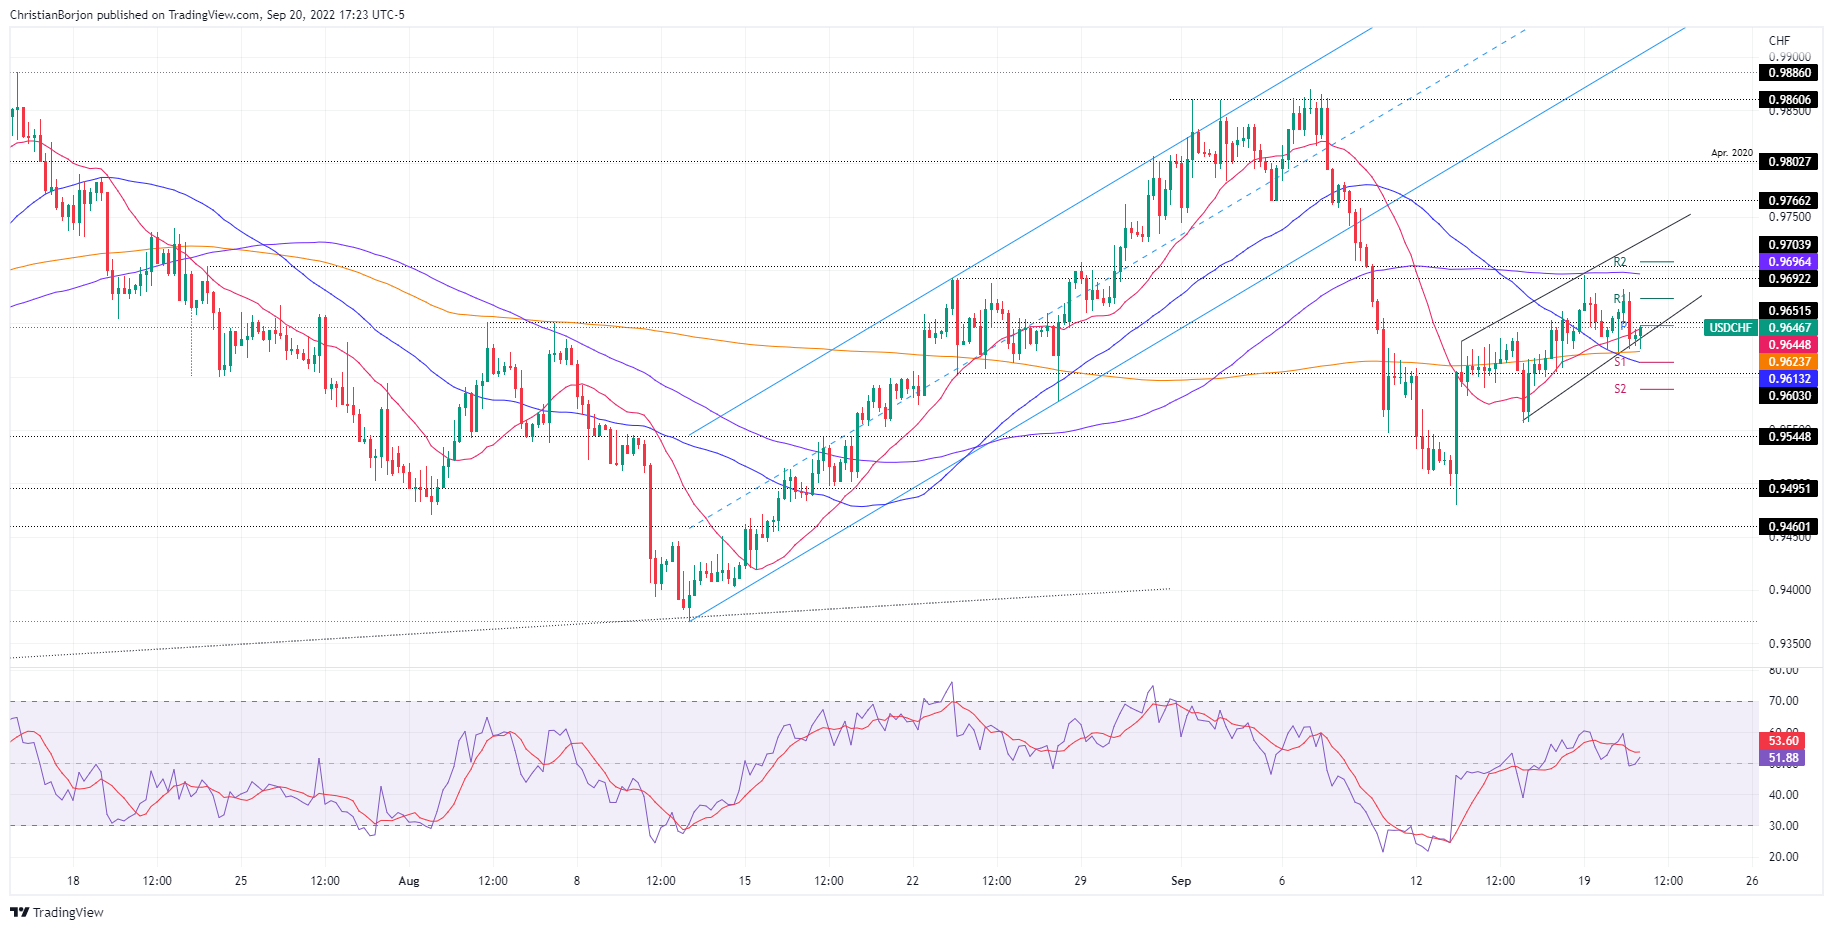
The USD/CHF daily chart portrays the major as range-bound, trading within the 20 and 50-day EMAs, each at 0.9685 and 0.9626, respectively. On Tuesday, the USD/CHF remained subdued due to choppy trading conditions, as it usually happens, with the Fed’s decision looming. The Relative Strength Index (RSI) depicts that the pair is bearish; nevertheless, with the major trading above the 200-day EMA at 0.9486 confirms the neutral bias.
The USD/CHF 4-hour scale portrays the pair as neutral-to-bearish biased. It’s worth noticing that the recent upward impulse encountered resistance at around the 100-EMA at 0.9690, with buyers falling short of reclaiming the 0.9700 figure. Hence, the USD/CHF slid below important EMAs but remained above the two-week up trendline.
If the USD/CHF breaks below 0.9630, that could pave the way for further losses. Therefore, the USD/CHF first support would be the 200-EMA at 0.9623. Once cleared, the next support would be the confluence of the S1 pivot and the 50-EMA at 0.9613, followed by the S2 daily pivot at 0.9588.
USD/CHF Key Technical Levels
Information on these pages contains forward-looking statements that involve risks and uncertainties. Markets and instruments profiled on this page are for informational purposes only and should not in any way come across as a recommendation to buy or sell in these assets. You should do your own thorough research before making any investment decisions. FXStreet does not in any way guarantee that this information is free from mistakes, errors, or material misstatements. It also does not guarantee that this information is of a timely nature. Investing in Open Markets involves a great deal of risk, including the loss of all or a portion of your investment, as well as emotional distress. All risks, losses and costs associated with investing, including total loss of principal, are your responsibility. The views and opinions expressed in this article are those of the authors and do not necessarily reflect the official policy or position of FXStreet nor its advertisers. The author will not be held responsible for information that is found at the end of links posted on this page.
If not otherwise explicitly mentioned in the body of the article, at the time of writing, the author has no position in any stock mentioned in this article and no business relationship with any company mentioned. The author has not received compensation for writing this article, other than from FXStreet.
FXStreet and the author do not provide personalized recommendations. The author makes no representations as to the accuracy, completeness, or suitability of this information. FXStreet and the author will not be liable for any errors, omissions or any losses, injuries or damages arising from this information and its display or use. Errors and omissions excepted.
The author and FXStreet are not registered investment advisors and nothing in this article is intended to be investment advice.
Recommended content
Editors’ Picks
EUR/USD holds below 1.0750 ahead of key US data

EUR/USD trades in a tight range below 1.0750 in the European session on Friday. The US Dollar struggles to gather strength ahead of key PCE Price Index data, the Fed's preferred gauge of inflation, and helps the pair hold its ground.
USD/JPY stays firm above 156.00 after BoJ Governor Ueda's comments

USD/JPY stays firm above 156.00 after surging above this level on the Bank of Japan's decision to leave the policy settings unchanged. BoJ Governor said weak Yen was not impacting prices but added that they will watch FX developments closely.
Gold price oscillates in a range as the focus remains glued to the US PCE Price Index

Gold price struggles to attract any meaningful buyers amid the emergence of fresh USD buying. Bets that the Fed will keep rates higher for longer amid sticky inflation help revive the USD demand.
Bitcoin Weekly Forecast: BTC’s next breakout could propel it to $80,000 Premium

Bitcoin’s recent price consolidation could be nearing its end as technical indicators and on-chain metrics suggest a potential upward breakout. However, this move would not be straightforward and could punish impatient investors.
US core PCE inflation set to signal firm price pressures as markets delay Federal Reserve rate cut bets

The core PCE Price Index, which excludes volatile food and energy prices, is seen as the more influential measure of inflation in terms of Fed positioning. The index is forecast to rise 0.3% on a monthly basis in March, matching February’s increase.