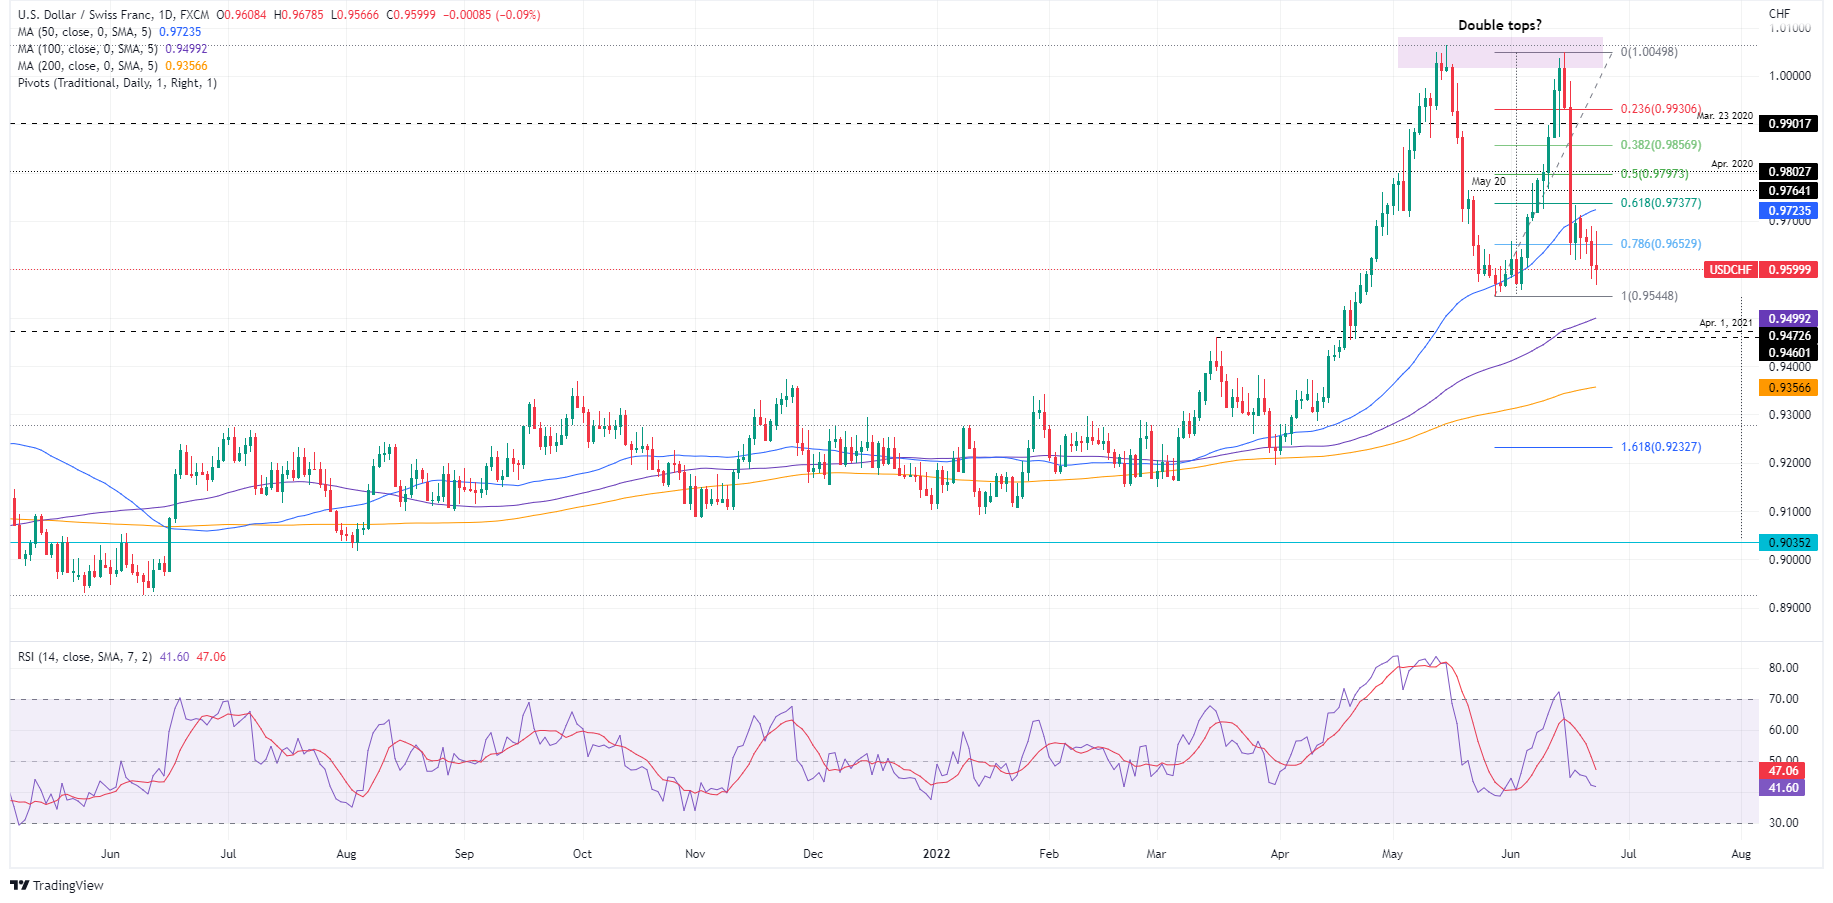
USD/CHF Price Analysis: Falls towards 0.9600 as sellers get ready to test double top’s neckline at 0.9540s


  • The Swiss franc extends its weekly gains to almost 1%, as shown by the USD/CHF falling from weekly highs above 0.9700.
  • Through the New York sesión, risk aversion pushed equities to negative territory and gave a fresh impulse to safe-haven assets, boosting the CHF.
  • USD/CHF Price Analysis: The formation of a double tops looms and will target 0.9150.

The USD/CHF extends to four, its fall from around the 50-day moving average (DMA), at that time around 0.9707, aiming towards the 0.9600 figure, for the first time since early June. At the time of writing, the USD/CHF is trading at 0.9600.

The market sentiment shifted sour as US equities dwindled, trading in the red. The risk-off impulse boosted the Swiss franc, which has accumulated gains of almost 1% in the week, as the USD/CHF has fallen from 09712 to the 0.9600 area. Nevertheless, the uptick of the greenback, as shown by the US Dollar Index, a gauge of the buck’s value against a basket of six peers, gaining 0.24%, sitting at 104.440, capped any USD/CHF falls.

USD/CHF Price Analysis: Technical outlook

Daily chart

From a daily chart perspective, the USD/CHF remains neutral biased. However, once the Relative Strength Index (RSI) collapsed from overbought territory and broke below the RSI’s 7-day SMA, it opened the door for further losses. Besides, the formation of a double top that has failed to be confirmed so far, unless the USD/CHF breaches the necklines around 0.9544, will send the pair tumbling towards 0.9150.

Therefore, the USD/CHF first support would be the 0.9600 figure. A breach of the latter would pave the way towards the double top neckline at 0.9544. Once cleared, the major’s next support would be the 100-day moving average (DMA) around 0.9499.

USD/CHF Key Technical Levels


Overview
Today last price 0.9606
Today Daily Change -0.0006
Today Daily Change % -0.06
Today daily open 0.9612
 
Trends
Daily SMA20 0.9716
Daily SMA50 0.9724
Daily SMA100 0.9499
Daily SMA200 0.9359
 
Levels
Previous Daily High 0.969
Previous Daily Low 0.9581
Previous Weekly High 1.005
Previous Weekly Low 0.9619
Previous Monthly High 1.0064
Previous Monthly Low 0.9545
Daily Fibonacci 38.2% 0.9623
Daily Fibonacci 61.8% 0.9648
Daily Pivot Point S1 0.9565
Daily Pivot Point S2 0.9518
Daily Pivot Point S3 0.9456
Daily Pivot Point R1 0.9674
Daily Pivot Point R2 0.9736
Daily Pivot Point R3 0.9783


Share: Feed news

Information on these pages contains forward-looking statements that involve risks and uncertainties. Markets and instruments profiled on this page are for informational purposes only and should not in any way come across as a recommendation to buy or sell in these assets. You should do your own thorough research before making any investment decisions. FXStreet does not in any way guarantee that this information is free from mistakes, errors, or material misstatements. It also does not guarantee that this information is of a timely nature. Investing in Open Markets involves a great deal of risk, including the loss of all or a portion of your investment, as well as emotional distress. All risks, losses and costs associated with investing, including total loss of principal, are your responsibility. The views and opinions expressed in this article are those of the authors and do not necessarily reflect the official policy or position of FXStreet nor its advertisers. The author will not be held responsible for information that is found at the end of links posted on this page.

If not otherwise explicitly mentioned in the body of the article, at the time of writing, the author has no position in any stock mentioned in this article and no business relationship with any company mentioned. The author has not received compensation for writing this article, other than from FXStreet.

FXStreet and the author do not provide personalized recommendations. The author makes no representations as to the accuracy, completeness, or suitability of this information. FXStreet and the author will not be liable for any errors, omissions or any losses, injuries or damages arising from this information and its display or use. Errors and omissions excepted.

The author and FXStreet are not registered investment advisors and nothing in this article is intended to be investment advice.

Recommended content


Recommended content

Editors’ Picks

EUR/USD turns negative near 1.0760

EUR/USD turns negative near 1.0760

The sudden bout of strength in the Greenback sponsored the resurgence of the selling pressure in the risk complex, dragging EUR/USD to the area of daily lows near 1.0760.

EUR/USD News

GBP/USD comes under pressure and challenges 1.2500

GBP/USD comes under pressure and challenges 1.2500

GBP/USD now rapidly loses momentum and gives away initial gains, returning to the 1.2500 region on the back of the strong comeback of the US Dollar.

GBP/USD News

Gold retreats from highs on stronger Dollar, yields

Gold retreats from highs on stronger Dollar, yields

XAU/USD trims part of its initial advance in response to the jump in the Dollar's buying interest and the re-emergence of the upside pressure in US yields.

Gold News

XRP tests support at $0.50 as Ripple joins alliance to work on blockchain recovery

XRP tests support at $0.50 as Ripple joins alliance to work on blockchain recovery

XRP trades around $0.5174 early on Friday, wiping out gains from earlier in the week, as Ripple announced it has joined an alliance to support digital asset recovery alongside Hedera and the Algorand Foundation. 

Read more

Week ahead – US inflation numbers to shake Fed rate cut bets

Week ahead – US inflation numbers to shake Fed rate cut bets

Fed rate-cut speculators rest hopes on US inflation data. After dovish BoE, pound traders turn to UK job numbers. Will a strong labor market convince the RBA to hike? More Chinese data on tap amid signs of slow Q2 start.

Read more

Forex MAJORS

Cryptocurrencies

Signatures