USD/CHF Price Analysis: Corrective bounce remains elusive below 0.9190


  • USD/CHF bounces off one-week low to print the first daily gain in three, retreats from intraday high of late.
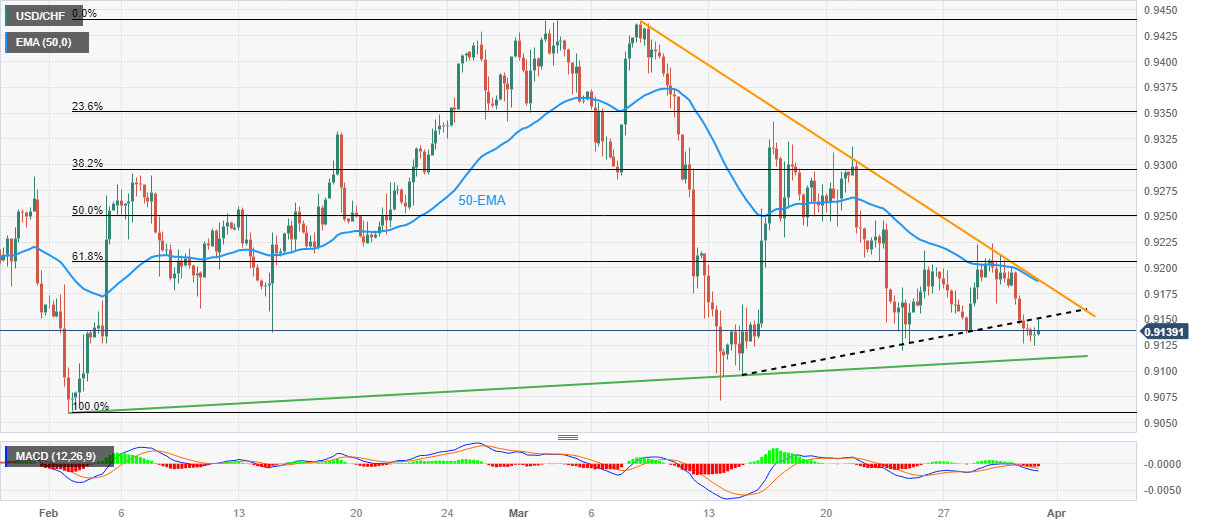
  • Clear downside break of 13-day-old previous support, bearish MACD signals keep sellers hopeful.
  • 50-EMA, descending resistance line from early March challenge Swiss Franc pair buyers.

USD/CHF pares the first daily gain in three around 0.9135 as the market’s anxiety ahead of the key US inflation data escalates during the initial hour of Friday’s European session. In doing so, the Swiss Franc (CHF) pair reverses from the previous support line from mid-March.

Not only the failure to cross the support-turned-resistance but the bearish MACD signals also weigh on the USD/CHF price.

As a result, the Swiss currency pair sellers are well-set to challenge an upward-sloping support line from early February, around 0.9110 by the press time.

It should be noted that a clear break of the said key support line will need validation from the 0.9100 round figure and the previous monthly low of around 0.9060 to convince the USD/CHF bears to prod the 0.9000 psychological magnet.

Meanwhile, an upside break of the aforementioned previous support line, close to 0.9150, isn’t an open invitation to the USD/CHF bulls.

The reason could be linked to the presence of a convergence of the 50-bar Exponential Moving Average (EMA) and a downward-sloping resistance line from March 09, close to 0.9190.

Even if the USD/CHF bulls manage to cross the 0.9190 resistance confluence, the 0.9200 round figure and 61.8% Fibonacci retracement level of its February-March upside, near 0.9205, may act as an extra check for the buyers.

USD/CHF: Four-hour chart

Trend: Further downside expected

Additional important levels

Overview
Today last price 0.9143
Today Daily Change 0.0014
Today Daily Change % 0.15%
Today daily open 0.9129
 
Trends
Daily SMA20 0.9247
Daily SMA50 0.9251
Daily SMA100 0.93
Daily SMA200 0.9521
 
Levels
Previous Daily High 0.9201
Previous Daily Low 0.9126
Previous Weekly High 0.9317
Previous Weekly Low 0.912
Previous Monthly High 0.9429
Previous Monthly Low 0.9059
Daily Fibonacci 38.2% 0.9155
Daily Fibonacci 61.8% 0.9172
Daily Pivot Point S1 0.9103
Daily Pivot Point S2 0.9078
Daily Pivot Point S3 0.9029
Daily Pivot Point R1 0.9178
Daily Pivot Point R2 0.9226
Daily Pivot Point R3 0.9252


Share: Feed news

Information on these pages contains forward-looking statements that involve risks and uncertainties. Markets and instruments profiled on this page are for informational purposes only and should not in any way come across as a recommendation to buy or sell in these assets. You should do your own thorough research before making any investment decisions. FXStreet does not in any way guarantee that this information is free from mistakes, errors, or material misstatements. It also does not guarantee that this information is of a timely nature. Investing in Open Markets involves a great deal of risk, including the loss of all or a portion of your investment, as well as emotional distress. All risks, losses and costs associated with investing, including total loss of principal, are your responsibility. The views and opinions expressed in this article are those of the authors and do not necessarily reflect the official policy or position of FXStreet nor its advertisers. The author will not be held responsible for information that is found at the end of links posted on this page.

If not otherwise explicitly mentioned in the body of the article, at the time of writing, the author has no position in any stock mentioned in this article and no business relationship with any company mentioned. The author has not received compensation for writing this article, other than from FXStreet.

FXStreet and the author do not provide personalized recommendations. The author makes no representations as to the accuracy, completeness, or suitability of this information. FXStreet and the author will not be liable for any errors, omissions or any losses, injuries or damages arising from this information and its display or use. Errors and omissions excepted.

The author and FXStreet are not registered investment advisors and nothing in this article is intended to be investment advice.

Recommended content


Recommended content

Editors’ Picks

EUR/USD holds above 1.0700 ahead of key US data

EUR/USD holds above 1.0700 ahead of key US data

EUR/USD trades in a tight range above 1.0700 in the early European session on Friday. The US Dollar struggles to gather strength ahead of key PCE Price Index data, the Fed's preferred gauge of inflation, and helps the pair hold its ground. 

EUR/USD News

USD/JPY stays above 156.00 after BoJ Governor Ueda's comments

USD/JPY stays above 156.00 after BoJ Governor Ueda's comments

USD/JPY holds above 156.00 after surging above this level with the initial reaction to the Bank of Japan's decision to leave the policy settings unchanged. BoJ Governor said weak Yen was not impacting prices but added that they will watch FX developments closely.

USD/JPY News

Gold price oscillates in a range as the focus remains glued to the US PCE Price Index

Gold price oscillates in a range as the focus remains glued to the US PCE Price Index

Gold price struggles to attract any meaningful buyers amid the emergence of fresh USD buying. Bets that the Fed will keep rates higher for longer amid sticky inflation help revive the USD demand.

Gold News

Sei Price Prediction: SEI is in the zone of interest after a 10% leap

Sei Price Prediction: SEI is in the zone of interest after a 10% leap

Sei price has been in recovery mode for almost ten days now, following a fall of almost 65% beginning in mid-March. While the SEI bulls continue to show strength, the uptrend could prove premature as massive bearish sentiment hovers above the altcoin’s price.

Read more

US core PCE inflation set to signal firm price pressures as markets delay Federal Reserve rate cut bets

US core PCE inflation set to signal firm price pressures as markets delay Federal Reserve rate cut bets

The core PCE Price Index, which excludes volatile food and energy prices, is seen as the more influential measure of inflation in terms of Fed positioning. The index is forecast to rise 0.3% on a monthly basis in March, matching February’s increase. 

Read more

Forex MAJORS

Cryptocurrencies

Signatures