|

USD/CHF Price Analysis: Bounces off weekly-lows reclaims 0.9100

  • The USD/CHF fall ended after three consecutive days amid a risk-off market mood.
  • The rise of the 10-year US Treasury yield underpins the greenback.
  • USD/CHF is neutral biased, but a bullish-engulfing candle pattern may open the door for an upside move; otherwise, it could challenge August 2021 monthly lows.

The USD/CHF snaps three straight days of losses, edges higher during the New York session, trading at 0.9139 at press time. A risk-off market mood, increased demand for safe-haven assets, usually benefits the CHF and the JPY, but not on Friday, with the USD recovering from earlier week losses.

The USD Dollar Index, a gauge of the greenback’s performance against six other currencies, advances som 0.29%, up to 95.96, underpinned by the 10-year benchmark note, which is rising 3.4 basis points, sitting at 1.754%.

USD/CHF Price Forecast: Technical outlook

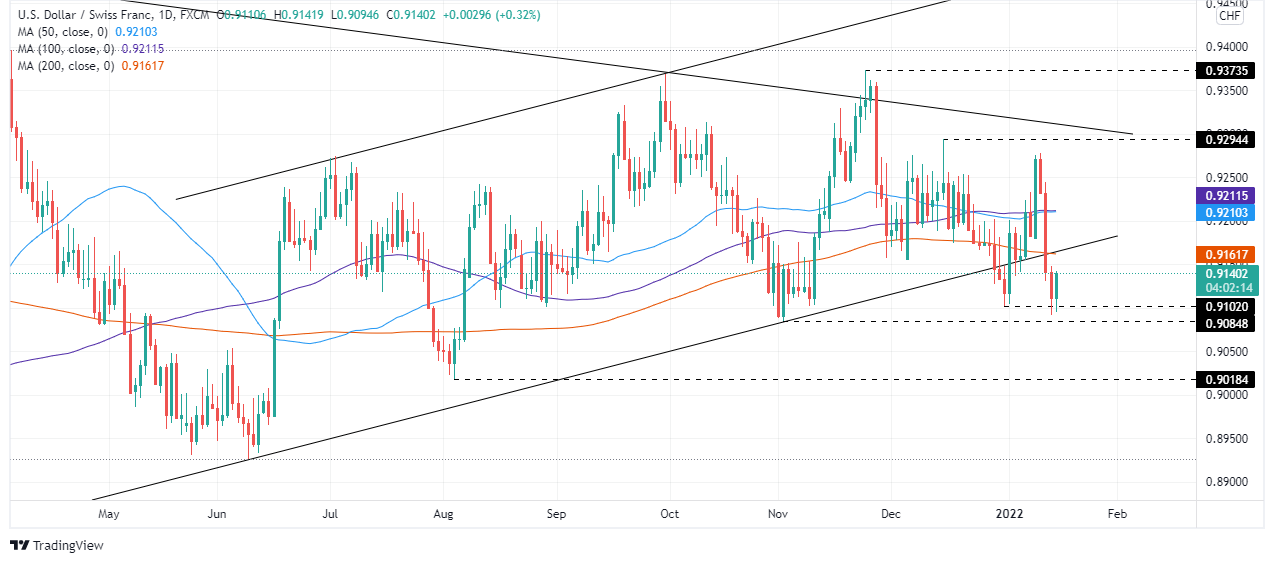
The USD/CHF daily chart depicts the consolidation of the pair inside an ascending channel; even though it was “pierced” on the bottom trendline, USD bears have not achieved a daily close under 0.9080.

If USD/CHF Friday’s daily close engulf Thursday’s candlestick price action, an upward move may be on the cards. In that outcome, the first resistance would be the 200-day moving average (DMA) previously broke at 0.9167. An aforementioned break would expose the confluence of th3 50 and the 100-DMA in the 0.9210-12 range, which once gave way to USD bulls, would send the pair rallying towards December 15, 2021 daily high at 0.9294.

Contrarily, failure of the abovementioned scenario would keep the USD/CHF neutral-downward biased. The USD/CHF first line of defense would be 0.9100. A breach of the latter would exert further downside pressure on the pair, exposing crucial support levels. The next one would be November 2, 2021, daily low at 0..9084, followed by August 4, 2021, cycle low at 0.9018.

USD/CHF

Overview
Today last price0.9139
Today Daily Change0.0025
Today Daily Change %0.27
Today daily open0.9114
 
Trends
Daily SMA200.9185
Daily SMA500.9214
Daily SMA1000.9215
Daily SMA2000.9166
 
Levels
Previous Daily High0.9149
Previous Daily Low0.9092
Previous Weekly High0.9232
Previous Weekly Low0.9113
Previous Monthly High0.9295
Previous Monthly Low0.9102
Daily Fibonacci 38.2%0.9114
Daily Fibonacci 61.8%0.9127
Daily Pivot Point S10.9088
Daily Pivot Point S20.9061
Daily Pivot Point S30.9031
Daily Pivot Point R10.9144
Daily Pivot Point R20.9175
Daily Pivot Point R30.9201

Author

Christian Borjon Valencia

Markets analyst, news editor, and trading instructor with over 14 years of experience across FX, commodities, US equity indices, and global macro markets.

More from Christian Borjon Valencia
Share:

Editor's Picks

AUD/USD falls to near 0.7100 after slipping below 50-day EMA

AUD/USD depreciates after registering minor gains in the previous day, trading around 0.7120 during the Asian hours. The technical analysis of the daily chart shows the pair consolidating sideways within a rectangle pattern, as neither bulls nor bears gain control. The AUD/USD pair is holding a slight bearish tone however as it sits beneath both the nine-day and 50-day EMAs.

160.00: USD/JPY back near intervention territory after upbeat US jobs report

US Nonfarm Payrolls beat expectations by a wide margin in May, with 172K jobs added. The US Dollar rebounds after the release, helping USD/JPY recover from its intraday lows. Warnings from Japanese authorities continue to limit upside potential near the 160.00 threshold.

Gold targets $4,300 amid stronger Dollar

Gold faces increasing selling interest and navigates the area of three-month lows near the $4,300 mark per troy ounce on Friday. The precious metal’s decline comes as traders assess the stronger-than-expected NFP, while the bid bias in the Greenback and higher US Treasury yields also collaborate with the retracement.

Cardano hits five-year low even as Hoskinson clarifies "break" isn't an exit

Cardano (ADA) price is down 10% at press time on Friday, extending losses over 30% so far this week amid Charles Hoskinson's clarification that "break" isn't an exit.

Week ahead – Fed countdown begins amid US inflation data and geopolitical risks

Fed Chair Warsh’s first meeting approaches as key US inflation data could reshape expectations. Oil prices remain elevated as US-Iran talks continue; tariffs also return to the spotlight. ECB is expected to hike; will it be a one-off move or is July live?

The US economy defies the rules: 100 days into the Oil shock and the recession signal is still missing

More than three months after the start of the Iran war and the resulting disruption to global energy markets, the US economy continues to display remarkable resilience. The conflict has triggered a sharp rise in Oil prices, reignited inflationary pressures and fueled widespread concerns about a potential economic slowdown.